Quantcast
Channel: ANBOB
Viewing all 691 articles
Browse latest View live

Oracle12c-19c如何防止安全检查查出弱密码?

$
0
0

ORACLE数据库在安全方面可靠度绝对完善,包括数据库用户的密码加密,在之前的老版本中如10G及以前,密码在dba_user.password显示密文, 由于使用的是DES加密,很容易从网上找到解密密文的方法,可以现在都12C–19C了,之前分享过《Oracle 12c 关于密码(password)的几个新特性小结》都已经引入了新的密码hash算法,怎么还经常能收到安全检查提示数据库用户有弱密码? 他们还能解密12c以后的PBKDF2的SHA512哈希算法? 那也太牛了吧,经常让DBA去改弱密码,DBA不能忍,于是研究一下怎么回事。

从安全提供12c数据库中个人用户密码的密文发现是类似“FC110DD5268B2BB5“这种短值,不应该呀,从哪取到的?USER$.password列。从11g以后密码区分大小写的值就已经存在了user$.spare4,但是为了向前兼容,在user$.password列还有以前老版本的不区分大小写密文。安全室就是从USER$.password列取到的值做的解密, 如果让他取不到这个值,自然也就解不了密。

到12c了为什么user$.password 有的数据库环境还有值?而有的没有? 是因为有些数据库为了应用或数据库客户端向低版本兼容,在$ORACLE_HOME/netword/admin/sqlnet.ora中的SQLNET.ALLOWED_LOGON_VERSION_SERVER 配置了如8等值,这个问题我在<升级12C注意事项: 连接失败 ORA-28040 ORA-1017提到过。

如果我们的客户端11.2.0.3以上,则没有必要配置低于version 12的值, 下面测试不同version对于user$.password的影响。

测试版本Oracle 19.3

[oracle@zcloud ~]$ for i in 8 9 10 11 12 12a; do 
> echo "change version $i ..."
> echo "SQLNET.ALLOWED_LOGON_VERSION_SERVER="$i > $ORACLE_HOME/network/admin/sqlnet.ora;  
> sqlplus -s / as sysdba< create user c##anbob$i identified by anbob1;
> exit;
> EOF
> done;
change version 8 ...

User created.

change version 9 ...

User created.

change version 10 ...

User created.

change version 11 ...

User created.

change version 12 ...

User created.

change version 12a ...

User created.


SQL> col name for a30
SQL> col password for a50
SQL> col password_ver for a30
SQL> 
SQL> select      decode(bitand(u.spare1, 65536), 65536, NULL, decode(
  2         REGEXP_INSTR(
  3           NVL2(u.password, u.password, ' '),
  4           '^                $'
  5         ),
  6         0,
  7         decode(length(u.password), 16, '10G ', NULL),
  8         ''
  9       ) ||
 10       decode(
 11         REGEXP_INSTR(
 12           REGEXP_REPLACE(
 13             NVL2(u.spare4, u.spare4, ' '),
 14             'S:000000000000000000000000000000000000000000000000000000000000',
 15             'not_a_verifier'
 16           ),
 17           'S:'
 18         ),
 19         0, '', '11G '
 20       ) ||
 21       decode(
 22         REGEXP_INSTR(
 23           NVL2(u.spare4, u.spare4, ' '),
 24           'T:'
 25         ),
 26         0, '', '12C '
 27       ) ||
 28       decode(
 29         REGEXP_INSTR(
 30           REGEXP_REPLACE(
 31             NVL2(u.spare4, u.spare4, ' '),
 32             'H:00000000000000000000000000000000',
 33             'not_a_verifier'
 34           ),
 35           'H:'
 36         ),
 37         0, '', 'HTTP '
 38       )) password_ver,name,password  from user$ u where name like 'C##ANBOB%';

PASSWORD_VER                   NAME                           PASSWORD
------------------------------ ------------------------------ --------------------------------------------------
10G 11G 12C                    C##ANBOB10                     0852D701E1A4619C
10G 11G 12C                    C##ANBOB11                     298571205D180182
11G 12C                        C##ANBOB12
12C                            C##ANBOB12A
10G 11G 12C                    C##ANBOB8                      AC6D78B1D13E979E
10G 11G 12C                    C##ANBOB9                      9DDA94FCEAA503BA

Note:
当SQLNET.ALLOWED_LOGON_VERSION_SERVER在12及12A时,user$.password列就不再有值。

Note: 本文的目的当然不是为了掩耳盗铃, 有些弱密码还是不建议使用,数据库也有自带的verify_function可以做为最基本的验证,我们也有自定义该方法,修改时过滤弱密码表,也是一种不错的方法。


Troubleshooting 12c ora-4031 “ges resource dynamic” lot of FB resource cache

$
0
0

Troubleshooting ORA-04031: unable to allocate 13840 bytes of shared memory “ges resource dynamic” in 12C+

记录过几个导致SGA中“ges resource dynamic”逐渐增大的问题,这里又在12c遇到了一个ora-4031问题,不太符合那里的描述和已知bug,  这里是在v$ges_resource中大量的FB资源的cache,这里简单记录。

oracle@anbob1:/home/oracle/support> cat > pro.sc < show incident -mode detail -p "problem_id=7"
> EOF
oracle@anbob1:/home/oracle/support> adrci script=pro.sc|grep -E "ERROR_ARG1|ERROR_ARG2|ERROR_ARG3|ERROR_ARG4|ERROR_ARG5"|grep -vE "ERROR_ARG10|ERROR_ARG11|ERROR_ARG12"
   CREATE_TIME                   2020-11-05 04:21:18.797000 +08:00
   ERROR_ARG1                    13840
   ERROR_ARG2                    shared pool
   ERROR_ARG3                    unknown object
   ERROR_ARG4                    sga heap(5,0)
   ERROR_ARG5                    ges resource dynamic
   CREATE_TIME                   2020-11-05 04:20:21.774000 +08:00
   ERROR_ARG1                    13840
   ERROR_ARG2                    shared pool
   ERROR_ARG3                    unknown object
   ERROR_ARG4                    sga heap(5,0)
   ERROR_ARG5                    ges resource dynamic
   CREATE_TIME                   2020-11-05 04:20:11.215000 +08:00
   ERROR_ARG1                    13840
   ERROR_ARG2                    shared pool
   ERROR_ARG3                    unknown object
   ERROR_ARG4                    sga heap(5,0)
   ERROR_ARG5                    ges resource dynamic
   CREATE_TIME                   2020-11-04 02:37:28.203000 +08:00
   ERROR_ARG1                    13840
   ERROR_ARG2                    shared pool
   ERROR_ARG3                    unknown object
   ERROR_ARG4                    sga heap(5,0)
   ERROR_ARG5                    ges resource dynamic
   CREATE_TIME                   2020-11-04 02:37:24.067000 +08:00
   ERROR_ARG1                    13840
   ERROR_ARG2                    shared pool
   ERROR_ARG3                    unknown object
   ERROR_ARG4                    sga heap(5,0)
   ERROR_ARG5                    ges resource dynamic
   CREATE_TIME                   2020-11-04 02:37:04.207000 +08:00
   ERROR_ARG1                    13840
   ERROR_ARG2                    shared pool
   ERROR_ARG3                    unknown object
   ERROR_ARG4                    sga heap(5,0)
   ERROR_ARG5                    ges resource dynamic
   
SQL> select inst_id,name,round(bytes/1024/1024/1024,1) in_gb from gv$sgastat where name='ges resource dynamic';

   INST_ID NAME                            IN_GB
---------- -------------------------- ----------
         1 ges resource dynamic              4.5
         2 ges resource dynamic              5.8

		 
 SQL> select * from (
    select substr(resource_name,instr(resource_name,'[',1,3)+1,2),master_node,count(*)
    from gv$ges_resource
    group by substr(resource_name,instr(resource_name,'[',1,3)+1,2),master_node
    order by 3 desc)
    where rownum<11;

SU MASTER_NODE   COUNT(*)
-- ----------- ----------
FB           1   13832551
FB           2    1418685
BL           2    1187476
BL           1    1106200
QQ           1      60828
QQ           2      60687
HW           1      38000
QC           1      28596
QI           1      24565
QI           2      24388

10 rows selected.
# You can use the following query to find the top enq:
SQL> select count(*) cnt,
  2  regexp_replace(resource_name2, '([^,])*,([^,]*),([^,]*)', '\3')   ges_type
  3  from v$ges_enqueue
  4  group by
  5  regexp_replace(resource_name2, '([^,])*,([^,]*),([^,]*)', '\3') order by 1 desc ;

       CNT GES_TYPE
---------- ----------
   7125283 FB
   2541211 BL
     19001 HW
     12298 YH
     12297 VH
      8512 WR
      8432 WL
      5137 VV
      4429 AE
      3251 AF
      2578 TS
      2440 CR
      1607 TM
      1261 GA
      1259 EA
      1174 MR
...

FB ==>Format Block 通常是insert等批量格式化数据库块。FB类型的GES资源无需CACHE(Bug 29922435).


SQL> @pd ges_dire
Show all parameters and session values from x$ksppi/x$ksppcv...

      INDX I_HEX NAME                                               VALUE                          DESCRIPTION
---------- ----- -------------------------------------------------- ------------------------------ ----------------------------------------------------------------------
      1086   43E _ges_direct_free                                   FALSE                          if TRUE, free each resource directly to the freelist
      1089   441 _ges_direct_free_res_type                          ARAH                           string of resource types(s) to directly free to the freelist
	  

解决方案
disable FB cache, like ‘BB’, Increase according to the type of cache,set the following:
“_ges_direct_free_res_type”=’CTARAHDXBBFB’

If there are more enq which are growing then please set the following:
_ges_direct_free=true

Troubleshoot import(imp) very slow into table(nologging) has lob columns

$
0
0

一套ORACLE 11c R2 Windows环境使用import 导入一张包含blob列时速度非常的慢(平均每秒10条),大家都知道imp里因为不能使用parallel等其它原因导入是慢一些,主要等待事件和时间是control file parallel write和enq: CF – contention,这么慢不能忍,下面是分析一下原因。

1, 查看导入的wait event,使用了Tanel Poder的snapper

SQL> select event,username,p1,p2,last_call_et,sid,logon_time,program from v$session where username is not null and status='ACTIVE';

EVENT                              USERNAME                               P1         P2 LAST_CALL_ET        SID LOGON_TIME     PROGRAM
---------------------------------- ------------------------------ ---------- ---------- ------------ ---------- -------------- --------------------
control file parallel write        HUIFU                                   2         15            0       1833 27-11月-20     imp.exe
enq: CF - contention               HUIFU                          1128660997          0            0       2311 28-11月-20     imp.exe
SQL*Net message to client          SYS                            1111838976          1            0       2671 28-11月-20     sqlplus.exe

SQL> @snapper all 5 1 1833
Sampling SID 1833 with interval 5 seconds, taking 1 snapshots...


---------------------------------------------------------------------------------------------------------------------------------------------------------------------------------
    SID, USERNAME  , TYPE, STATISTIC                                                 ,         DELTA, HDELTA/SEC,    %TIME, GRAPH       , NUM_WAITS,  WAITS/SEC,   AVERAGES
---------------------------------------------------------------------------------------------------------------------------------------------------------------------------------
   1833, HUIFU     , STAT, Requests to/from client                                   ,            84,      16.24,         ,             ,          ,           ,          1 per e
   1833, HUIFU     , STAT, user calls                                                ,            84,      16.24,         ,             ,          ,           ,          1 per e
   1833, HUIFU     , STAT, session logical reads                                     ,          1191,     230.28,         ,             ,          ,           ,      14.18 per e
   1833, HUIFU     , STAT, CPU used when call started                                ,            19,       3.67,         ,             ,          ,           ,        .23 per e
   1833, HUIFU     , STAT, CPU used by this session                                  ,            19,       3.67,         ,             ,          ,           ,        .23 per e
   1833, HUIFU     , STAT, DB time                                                   ,           515,      99.57,         ,             ,          ,           ,       6.13 per e
   1833, HUIFU     , STAT, user I/O wait time                                        ,           127,      24.56,         ,             ,          ,           ,       1.51 per e
   1833, HUIFU     , STAT, non-idle wait time                                        ,           500,      96.67,         ,             ,          ,           ,       5.95 per e
   1833, HUIFU     , STAT, non-idle wait count                                       ,          1121,     216.74,         ,             ,          ,           ,      13.35 per e
   1833, HUIFU     , STAT, session pga memory                                        ,       -131072,    -25.34k,         ,             ,          ,           ,     -1.56k per e
   1833, HUIFU     , STAT, enqueue waits                                             ,            58,      11.21,         ,             ,          ,           ,        .69 per e
   1833, HUIFU     , STAT, enqueue requests                                          ,           463,      89.52,         ,             ,          ,           ,       5.51 per e
   1833, HUIFU     , STAT, enqueue releases                                          ,           465,      89.91,         ,             ,          ,           ,       5.54 per e
   1833, HUIFU     , STAT, physical read total IO requests                           ,           595,     115.04,         ,             ,          ,           ,       7.08 per e
   1833, HUIFU     , STAT, physical read total bytes                                 ,       8929280,      1.73M,         ,             ,          ,           ,     106.3k per e
   1833, HUIFU     , STAT, physical write total IO requests                          ,           449,      86.81,         ,             ,          ,           ,       5.35 per e
   1833, HUIFU     , STAT, physical write total bytes                                ,       6021120,      1.16M,         ,             ,          ,           ,     71.68k per e
   1833, HUIFU     , STAT, cell physical IO interconnect bytes                       ,      14950400,      2.89M,         ,             ,          ,           ,    177.98k per e
   1833, HUIFU     , STAT, total cf enq hold time                                    ,          1845,     356.73,         ,             ,          ,           ,      21.96 per e
   1833, HUIFU     , STAT, total number of cf enq holders                            ,           100,      19.33,         ,             ,          ,           ,       1.19 per e
   1833, HUIFU     , STAT, db block gets                                             ,           923,     178.46,         ,             ,          ,           ,      10.99 per e
   1833, HUIFU     , STAT, db block gets from cache                                  ,           758,     146.56,         ,             ,          ,           ,       9.02 per e
   1833, HUIFU     , STAT, db block gets from cache (fastpath)                       ,           482,      93.19,         ,             ,          ,           ,       5.74 per e
   1833, HUIFU     , STAT, db block gets direct                                      ,           165,       31.9,         ,             ,          ,           ,       1.96 per e
   1833, HUIFU     , STAT, consistent gets                                           ,           268,      51.82,         ,             ,          ,           ,       3.19 per e
   1833, HUIFU     , STAT, consistent gets from cache                                ,           135,       26.1,         ,             ,          ,           ,       1.61 per e
   1833, HUIFU     , STAT, consistent gets from cache (fastpath)                     ,           115,      22.24,         ,             ,          ,           ,       1.37 per e
   1833, HUIFU     , STAT, consistent gets - examination                             ,            19,       3.67,         ,             ,          ,           ,        .23 per e
   1833, HUIFU     , STAT, consistent gets direct                                    ,           133,      25.72,         ,             ,          ,           ,       1.58 per e
   1833, HUIFU     , STAT, logical read bytes from cache                             ,       7315456,      1.41M,         ,             ,          ,           ,     87.09k per e
   1833, HUIFU     , STAT, physical reads                                            ,           100,      19.33,         ,             ,          ,           ,       1.19 per e
   1833, HUIFU     , STAT, physical reads direct                                     ,           100,      19.33,         ,             ,          ,           ,       1.19 per e
   1833, HUIFU     , STAT, physical read IO requests                                 ,           100,      19.33,         ,             ,          ,           ,       1.19 per e
   1833, HUIFU     , STAT, physical read bytes                                       ,        819200,    158.39k,         ,             ,          ,           ,      9.75k per e
   1833, HUIFU     , STAT, db block changes                                          ,           460,      88.94,         ,             ,          ,           ,       5.48 per e
   1833, HUIFU     , STAT, physical writes                                           ,           165,       31.9,         ,             ,          ,           ,       1.96 per e
   1833, HUIFU     , STAT, physical writes direct                                    ,           165,       31.9,         ,             ,          ,           ,       1.96 per e
   1833, HUIFU     , STAT, physical write IO requests                                ,           165,       31.9,         ,             ,          ,           ,       1.96 per e
   1833, HUIFU     , STAT, physical write bytes                        
'              ,       1351680,    261.35k,         ,             ,          ,           ,     16.09k per e
   1833, HUIFU     , STAT, physical writes non checkpoint                            ,           165,       31.9,         ,             ,          ,           ,       1.96 per e
   1833, HUIFU     , STAT, free buffer requested                                     ,             1,        .19,         ,             ,          ,           ,        .01 per e
   1833, HUIFU     , STAT, physical reads direct (lob)                               ,            50,       9.67,         ,             ,          ,           ,         .6 per e
   1833, HUIFU     , STAT, physical writes direct (lob)                              ,           165,       31.9,         ,             ,          ,           ,       1.96 per e
   1833, HUIFU     , STAT, shared hash latch upgrades - no wait                      ,             1,        .19,         ,             ,          ,           ,        .01 per e
   1833, HUIFU     , STAT, calls to kcmgcs                                           ,           169,      32.68,         ,             ,          ,           ,       2.01 per e
   1833, HUIFU     , STAT, calls to kcmgas                                           ,            51,       9.86,         ,             ,          ,           ,        .61 per e
   1833, HUIFU     , STAT, calls to get snapshot scn: kcmgss                         ,           318,      61.48,         ,             ,          ,           ,       3.79 per e
   1833, HUIFU     , STAT, redo entries                                              ,           421,       81.4,         ,             ,          ,           ,       5.01 per e
   1833, HUIFU     , STAT, redo size                                                 ,        169380,     32.75k,         ,             ,          ,           ,          ~ bytes
   1833, HUIFU     , STAT, redo size for direct writes                               ,          8580,      1.66k,         ,             ,          ,           ,     102.14 per e
   1833, HUIFU     , STAT, redo ordering marks                                       ,             1,        .19,         ,             ,          ,           ,        .01 per e
   1833, HUIFU     , STAT, redo subscn max counts                                    ,             1,        .19,         ,             ,          ,           ,        .01 per e
   1833, HUIFU     , STAT, file io wait time                                         ,        188187,     36.39k,         ,             ,          ,           ,      2.24k per e
   1833, HUIFU     , STAT, Effective IO time                                         ,         39152,      7.57k,         ,             ,          ,           ,      466.1 per e
   1833, HUIFU     , STAT, Number of read IOs issued                                 ,            50,       9.67,         ,             ,          ,           ,         .6 per e
   1833, HUIFU     , STAT, undo change vector size                                   ,         13388,      2.59k,         ,             ,          ,           ,     159.38 per e
   1833, HUIFU     , STAT, no work - consistent read gets                            ,             1,        .19,         ,             ,          ,           ,        .01 per e
   1833, HUIFU     , STAT, active txn count during cleanout                          ,            18,       3.48,         ,             ,          ,           ,        .21 per e
   1833, HUIFU     , STAT, cleanout - number of ktugct calls                         ,            18,       3.48,         ,             ,          ,           ,        .21 per e
   1833, HUIFU     , STAT, index crx upgrade (positioned)                            ,             1,        .19,         ,             ,          ,           ,        .01 per e
   1833, HUIFU     , STAT, lob writes                                                ,            84,      16.24,         ,             ,          ,           ,          1 per e
   1833, HUIFU     , STAT, index scans kdiixs1                                       ,             1,        .19,         ,             ,          ,           ,        .01 per e
   1833, HUIFU     , STAT, HSC Heap Segment Block Changes                            ,            84,      16.24,         ,             ,          ,           ,          1 per e
   1833, HUIFU     , STAT, execute count                                             ,            84,      16.24,         ,             ,          ,           ,          ~ execu
   1833, HUIFU     , STAT, bytes sent via SQL*Net to client                          ,         12768,      2.47k,         ,             ,          ,           ,        152 bytes
   1833, HUIFU     , STAT, bytes received via SQL*Net from client                    ,        904906,    174.96k,         ,             ,          ,           ,     10.77k per e
   1833, HUIFU     , STAT, SQL*Net roundtrips to/from client                         ,            84,      16.24,         ,             ,          ,           ,          1 per e
   1833, HUIFU     , TIME, DB CPU                                                    ,        187500,    36.25ms,     3.6%, [@         ],          ,           ,
   1833, HUIFU     , TIME, sql execute elapsed time                                  ,       5221045,      1.01s,   100.9%, [##########],          ,           ,
   1833, HUIFU     , TIME, DB time                                                   ,       5163529,   998.36ms,    99.8%, [##########],          ,           ,    24.87ms unacc
   1833, HUIFU     , WAIT, control file sequential read                              ,        777869,    150.4ms,    15.0%, [WW        ],       515,      99.57,     1.51ms avera
   1833, HUIFU     , WAIT, control file parallel write                               ,       1593723,   308.14ms,    30.8%, [WWWW      ],       144,      27.84,    11.07ms avera
   1833, HUIFU     , WAIT, db file sequential read                                   ,        190925,    36.92ms,     3.7%, [W         ],        51,       9.86,     3.74ms avera
   1833, HUIFU     , WAIT, direct path read                                          ,         39362,     7.61ms,      .8%, [W         ],        51,       9.86,    771.8us avera
   1833, HUIFU     , WAIT, direct path write                                         ,       1064754,   205.87ms,    20.6%, [WWW       ],       122,      23.59,     8.73ms avera
   1833, HUIFU     , WAIT, SQL*Net message to client                                 ,           488,    94.35us,      .0%, [          ],        85,      16.43,     5.74us avera
   1833, HUIFU     , WAIT, SQL*Net message from client                               ,         16401,     3.17ms,      .3%, [          ],        85,      16.43,   192.95us avera
   1833, HUIFU     , WAIT, SQL*Net more data from client                             ,           688,   133.02us,      .0%, [          ],        33,       6.38,    20.85us avera
   1833, HUIFU     , WAIT, events in waitclass Other                                 ,       1337581,   258.62ms,    25.9%, [WWW       ],        59,      11.41,    22.67ms avera

--  End of Stats snap 1, end=2020-11-28 12:53:05, seconds=5.2


----------------------------------------------------------------------------------------------------
Active% | INST | SQL_ID          | SQL_CHILD | EVENT                               | WAIT_CLASS
----------------------------------------------------------------------------------------------------
    33% |    1 | 7wf7739g9w3gz   | 2         | control file parallel write         | System I/O
    27% |    1 | 7wf7739g9w3gz   | 2         | enq: CF - contention                | Other
    20% |    1 | 7wf7739g9w3gz   | 2         | direct path write                   | User I/O
    13% |    1 | 7wf7739g9w3gz   | 2         | control file sequential read        | System I/O
     2% |    1 |                 |           | ON CPU                              | ON CPU
     2% |    1 | 7wf7739g9w3gz   | 2         | ON CPU                              | ON CPU
     2% |    1 | 7wf7739g9w3gz   | 2         | db file sequential read             | User I/O

--  End of ASH snap 1, end=2020-11-28 12:53:05, seconds=5, samples_taken=45


SQL> select sql_text from v$sqlarea where sql_id='7wf7739g9w3gz';

SQL_TEXT
--------------------------------------------------------------------------- - ------------------------------ 
INSERT /*+NESTED_TABLE_SET_REFS+*/ INTO "TAB_ANBOB" ("CONTENT", "FILE_UNIQUE_ID") VALUES (:1, :2)

SQL> desc huifu.TAB_ANBOB
 名称                类型
 ---------------- ----------------------------------------------------------
 CONTENT       BLOB
 FILE_UNIQUE_ID   VARCHAR2(48)

SQL> SELECT OWNER,LOGGING FROM DBA_TABLES WHERE TABLE_NAME='TAB_ANBOB';

OWNER                          LOG
------------------------------ ---
HUIFU                          NO

Note:
表为了减少redo产生配置了nologging. 主要等待事件和时间是control file parallel write和enq: CF – contention

imp 语句

imp huifu/huifu file=E:\xxx.dmp buffer=102400000 feedback=10000 commit=y full=y data_only=yes

Note:
这里是想每10k commit一次,但是包含lob列的表,如果指定了commit=y也是一行一commit.
“For tables containing LONG, LOB, BFILE, REF, ROWID, UROWID columns, array inserts are not done. If COMMIT=y, Import commits these tables after each row.”

我之前的笔记中Troubleshooting performance event ‘enq: CF – contention’ 记录过most likely that the contention for the CF enqueue is caused by DML on a NOLOGGING object. When the modification work is performed on the data file under the nologging option, the control file needs to be updated in order to modify the unrecoverable SCN.

当修改nologging的对象时,控制文件需要更新unrecoverable SCN, 同时imp lob是每行commit,导致controlfile频繁的更新产生了控制文件相关的等待。 解决方法是启用logging或配置 event 10359 to level 1 跳过更新 unrecoverable SCN’s in the control file. 从11.2.0.2 引入了参数DB_UNRECOVERABLE_SCN_TRACKING

DB_UNRECOVERABLE_SCN_TRACKING enables or disables the tracking of unrecoverable (NOLOGGING) direct-path insert and load operations.

Ixora Said

If your application performs frequent NOLOGGING operations, particularly frequent small changes to NOLOGGING LOBs, then you may find that it also spends a lot of time waiting for control file sequential read and control file parallel write waits. In some real world applications, these waits have been seen to account for as much as 20% of application response time.

Why does Oracle do so much I/O to the controlfile? It is because whenever a datafile is changed by a NOLOGGING operation, the unrecoverable SCN for that datafile, which is stored in the controlfile, needs to be updated. These updates must occur in controlfile transactions to permit recoverability from an instance crash while the controlfile is being changed.

Unfortunately, controlfile transactions are very I/O intensive. Each controlfile transaction requires at least two reads and two data synchronous writes per controlfile copy. If the controlfiles are buffered by the operating system’s file system buffer cache, then the reads may be relatively cheap. Even so, in a typical environment with two or three controlfile copies, a controlfile transaction must nevertheless wait for 4 or 6 random physical writes to the controlfiles.

If your application makes frequent small changes to NOLOGGING LOBs, then it may well be that the controlfile transactions required to update the unrecoverable SCN are actually taking a lot longer than it would take to log the redo for the LOB changes if the LOBs were changed to LOGGING. However, there is a better alternative — namely, setting event 10359. Most numeric events are undocumented, and not normally supported. However, this particular event is sanctioned with a reference in the Oracle9i Application Developer’ Guide – Large Objects (LOBs).

Event 10359 disables all updates of unrecoverable SCNs. By setting this event you can retain the performance benefit of not logging LOB changes without sustaining the performance penalty of repeated foreground controlfile transactions. The only disadvantage is that RMAN will no longer be able to report which datafiles have recently been affected by NOLOGGING operations, and so you will have to adopt a backup strategy that compensates for that.

启用LOGGING的方法, 创建另一用户huifu2下使用logging table, 测试.

SQL> select owner,logGing from dba_tables where table_name='TAB_ANBOB';

OWNER                          LOG
------------------------------ ---
HUIFU2                         YES
HUIFU                          NO

SQL> select event,username,p1,p2,last_call_et,sid,logon_time,program from v$session where username is not null and status='ACTIVE';

EVENT                                    USERNAME                               P1         P2 LAST_CALL_ET        SID
---------------------------------------- ------------------------------ ---------- ---------- ------------ ----------
control file parallel write              HUIFU                                   2         15            0       1833
direct path write                        HUIFU2                                 14    1602160            0       2025
enq: CF - contention                     HUIFU                          1128660997          0            0       2311
SQL*Net message to client                SYS                            1111838976          1            0       2671


SQL> @snapper ash 5 1 2025
----------------------------------------------------------------------------------------------------
Active% | INST | SQL_ID          | SQL_CHILD | EVENT                               | WAIT_CLASS
----------------------------------------------------------------------------------------------------
    55% |    1 | 7wf7739g9w3gz   | 3         | direct path write                   | User I/O
    24% |    1 |                 |           | log file sync                       | Commit
     8% |    1 | 7wf7739g9w3gz   | 3         | direct path read                    | User I/O
     5% |    1 | 7wf7739g9w3gz   | 3         | db file sequential read             | User I/O
     3% |    1 | 7wf7739g9w3gz   | 3         | ON CPU                              | ON CPU

--  End of ASH snap 1, end=2020-11-28 13:28:03, seconds=5, samples_taken=38

速度恢复了正常,wait event转到了lob 数据对象上。
RMAN-06169: could not read file header during RMAN duplicate database

$
0
0

近期有个友商在做RMAN duplidate database搭建DG时,因为primary db上有offline 的datafile ,并且归档已经丢失,无法再做recover ,online datafile的操作,操作系统或存储上的datafile已经不存在,duplicate时报错如下。

Starting backup at 19-NOV-20
RMAN-06169: could not read file header for datafile 357 error reason 4
released channel: prmy1
released channel: prmy2
released channel: prmy3
released channel: prmy4
released channel: stby
RMAN-00571: ===========================================================
RMAN-00569: =============== ERROR MESSAGE STACK FOLLOWS ===============
RMAN-00571: ===========================================================
RMAN-03002: failure of Duplicate Db command at 11/19/2020 17:15:03
RMAN-05501: aborting duplication of target database
RMAN-03015: error occurred in stored script Memory Script
RMAN-06056: could not access datafile 357

发现主库上有offline状态的datafile: file#=357 name=+DATA/tyjc/datafile/service_main_dat.256.862604801

[oracle@oel7db1 ~]$ oerr rman 6169
6169, 3, "could not read file header for datafile %(1)s error reason %(2)s"
// *Cause: The specified data file could not be accessed. The reason
// codes are:
// 1 - file name is MISSINGxx in the control file
// 2 - file is offline
// 3 - file is not verified
// 4 - DBWR could not find the file
// 5 - unable to open file
// 6 - I/O error during read
// 7 - file header is corrupt
// 8 - file is not a data file
// 9 - file does not belong to this database
// 10 - file number is incorrect
// 12 - wrong file version
// 15 - control file is not current
// *Action: If the error can be corrected, do so and retry the operation.
// The SKIP option can be used to ignore this error during a backup.

Oracle官方支持的方法1是rman 备份指定skip,Try this command to SKIP the offline and corrupted datafiles:

BACKUP DATABASE
SKIP INACCESSIBLE
SKIP OFFLINE;

SKIP INACCESSIBLE: Inaccessible datafiles. A datafile is only considered inaccessible if it cannot be read. Some offline datafiles can still be read because they exist on disk. Others have been deleted or moved and so cannot be read, making them inaccessible.

SKIP OFFLINE: skipping Offline datafiles;

rman生成备份集的方法可行,但是duplicate database中没有skip INACCESSIBLE, 只有skip readonly 和skip tablespace:

DUPLICATE Options Explanation
SKIP READONLY Excludes the data files of read-only tablespaces from the duplicate database.
SKIP TABLESPACE 'tablespace_name ', ... Excludes the specified tablespaces from the duplicate database. You cannot exclude the SYSTEM and SYSAUX tablespaces, tablespaces with SYS objects, undo tablespaces, tablespaces with undo segments, tablespaces with materialized views, or tablespaces in such a way that the duplicated tablespaces are not self-contained.

支持的方法2, 把该表空间(包含offline datafile)的对象move到其它表空间, drop tablespace xxx including datafile and contents,或duplicate skip tablespace。

或者
alter database create datafile ”; — 创建出OS或存储已不存在的物理数据文件,但还是offline的。

官方不支持的方法:
1,alter database create datafile ”;
2,bbed 修改checkpoint scn信息;
3,recover datafile;
4,online datafile;
5, drop datafile;

Troubleshooting 19c RAC CRS resource db show “UNKNOWN” state , srvctl start instance CRS-2680

$
0
0

有套ORACLE 19c RAC在使用crsctl 查看db resource时显示“UNKNOWN”, 但是用sqlplus 可以启动db 实例,srvctl status instance显示not running. 手动启动instance 使用srvctl 显示如下错误

[oracle@~]$ srvctl start instance -d  -i INTS1
PRCR-1013 : Failed to start resource ora..db
PRCR-1064 : Failed to start resource ora..db on node 
CRS-2680: Clean of 'ora..db' on '' failed
CRS-5802: Unable to start the agent process

之前有做srvctl remove instance和database的操作情况依旧。

GI alert log

2020-12-05 15:52:11.687 [CRSD(7541)]CRS-2758: Resource 'ora.hmracdg.db' is in an unknown state.
2020-12-05 15:57:50.688 [CRSD(7541)]CRS-5828: Could not start agent '/u01/app/19.3.0/grid/bin/oraagent_oracle'. Details at (:CRSAGF00130:) {1:2872:4034} in /u01/app/grid/diag/crs/anbob1/crs/trace/crsd.trc.
2020-12-05 16:07:52.408 [CRSD(7541)]CRS-5828: Could not start agent '/u01/app/19.3.0/grid/bin/oraagent_oracle'. Details at (:CRSAGF00130:) {1:2872:4288} in /u01/app/grid/diag/crs/anbob1/crs/trace/crsd.trc.

crs log

2020-12-05 16:39:35.288 :   CRSPE:585066240: [     INFO] {1:2872:5072} Expression Filter : ((LAST_SERVER == anbob01) AND (NAME == ora.scan1.vip))
2020-12-05 16:39:35.291 :UiServer:578762496: [     INFO] {1:2872:5072} Done for ctx=0x7fa7e003bb10
2020-12-05 16:39:39.934 :GIPCHTHR:3034482432:  gipchaDaemonWork: DaemonThread heart beat, time interval since last heartBeat 30830loopCount 28
2020-12-05 16:40:00.294 :    CRSD:597673728: [     NONE] {1:2872:4988} {1:2872:4988} Created alert : (:CRSAGF00130:) :  Failed to start the agent /u01/app/19.3.0/grid/bin/oraagent_oracle
2020-12-05 16:40:00.294 :    AGFW:597673728: [     INFO] {1:2872:4988} Rejecting pending msgs for ora.anbob.db 1 1
2020-12-05 16:40:00.294 :    AGFW:597673728: [     INFO] {1:2872:4988} Rejecting msg: 4100
2020-12-05 16:40:00.294 :    AGFW:597673728: [     INFO] {1:2872:4988} Agfw Proxy Server sending the last reply to PE for message:RESOURCE_CLEAN[ora.anbob.db 1 1] ID 4100:11921
2020-12-05 16:40:00.294 :    AGFW:597673728: [     INFO] {1:2872:4988} Can not stop the agent: /u01/app/19.3.0/grid/bin/oraagent_oracle because pid is not initialized
2020-12-05 16:40:00.294 :   CRSPE:585066240: [     INFO] {1:2872:4988} Received reply to action [Clean] message ID: 11921
2020-12-05 16:40:00.294 :   CRSPE:585066240: [     INFO] {1:2872:4988} RI [ora.anbob.db 1 1] new internal state: [STABLE] old value: [CLEANING]
2020-12-05 16:40:00.294 :   CRSPE:585066240: [     INFO] {1:2872:4988} Fatal Error from AGFW Proxy: Unable to start the agent process
2020-12-05 16:40:00.294 :   CRSPE:585066240: [     INFO] {1:2872:4988} CRS-2680: Clean of 'ora.anbob.db' on 'anbob01' failed

2020-12-05 16:40:00.294 :   CRSPE:585066240: [     INFO] {1:2872:4988} Command [0x7fa7f446c290] has sent a progress reply:CRS-2680: Clean of 'ora.anbob.db' on 'anbob01' /
 for [ora.anbob.db]
2020-12-05 16:40:00.294 :UiServer:578762496: [     INFO] {1:2872:4988} Response: c4|5!ORDERk7|MESSAGEt57|CRS-2680: Clean of 'ora.anbob.db' on 'anbob01' failedk7|MSGTYPEt1|1k5|OBJIDt14|ora.anbob.dbk4|WAITt1|0
2020-12-05 16:40:00.295 :   CRSPE:585066240: [     INFO] {1:2872:4988} Sequencer for [ora.anbob.db 1 1] has completed with error: CRS-5802: Unable to start the agent process

2020-12-05 16:40:00.295 :   CRSPE:585066240: [     INFO] {1:2872:4988} Deleting RI-path from op-history:ora.anbob.db 1 1

oraagent启动失败,在11G 里需要检查

$ ls -ld /log//agent/crsd/oraagent_oracle
drwxrwxrwt. 2 oracle oinstall 4096 Aug 22 10:52 /log//agent/crsd/oraagent_oracle

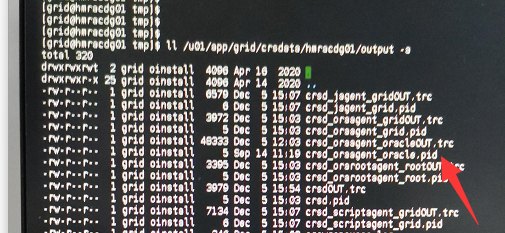
从Grid Infrastructure版本12.1.0.2开始,每个守护进程的pid文件不仅存在于//.pid, 也在/crsdata//output/.pid. 根据MOS 2028511.1 记录,查看/tmp下新生的oraagent*.out 文件

/tmp/oragent_nnnn.out

Oracle Clusterware infrastructure error in ORAAGENT (OS PID 4976): Error in an OS-dependent function or service
Error category: -2, operation: open, location: SCLSB00009, OS error: 13
OS error message: Permission denied
Additional information: Call to open daemon stdout/stderr file failed
Oracle Clusterware infrastructure fatal error in ORAAGENT (OS PID 4976): Internal error (ID (:CLSB00126:)) - Failed to redirect daemon standard outputs using location /u01/app/grid/crsdata/anbob1/output and root name crsd_oraagent_oracle

cluvfy comp software -n all -verbose 因为只检查binary file, 未显示软件权限问题,手动检查/crsdata//output/ 下pid文件权限

发现当前目录的所有文件被chomd grid:oinstall *,和chmod 775 *, DBA对数据库应该有些敬畏之心,不要简单认为给777就ok, GRID_HOME也并非所有文件都grid owner, 当误操作时可以参考How to check and fix file permissions on Grid Infrastructure environment (Doc ID 1931142.1) 修正binary file, 然后参考正常节点修改错误节点。

pid在 GRID_HOME正常的权限如下:

-rw-r--r--. 1 root root 0 Jul 29 14:52 ./crs/init/lccn0
-rw-r--r--. 1 root root 5 Dec 1 08:35 ./crs/init/lccn0.pid
-rw-r--r--. 1 root root 0 Jul 29 14:51 ./ctss/init/lccn0
-rw-r--r--. 1 root root 5 Dec 1 08:35 ./ctss/init/lccn0.pid
-rw-r--r--. 1 grid oinstall 0 Jul 29 14:50 ./evm/init/lccn0
-rw-r--r--. 1 grid oinstall 5 Dec 1 08:34 ./evm/init/lccn0.pid
-rw-r--r--. 1 grid oinstall 5 Dec 1 08:34 ./gipc/init/lccn0
-rw-r--r--. 1 grid oinstall 5 Dec 1 08:34 ./gipc/init/lccn0.pid
-rw-r--r--. 1 grid oinstall 0 Jul 29 14:50 ./gpnp/init/lccn0
-rw-r--r--. 1 grid oinstall 5 Dec 1 08:34 ./gpnp/init/lccn0.pid
-rw-r--r--. 1 grid oinstall 0 Jul 29 14:50 ./mdns/init/lccn0
-rw-r--r--. 1 grid oinstall 5 Dec 1 08:34 ./mdns/init/lccn0.pid
-rw-r--r--. 1 root root 0 Jul 29 14:50 ./ohasd/init/lccn0
-rw-r--r--. 1 root root 5 Dec 1 08:34 ./ohasd/init/lccn0.pid
-rw-r--r--. 1 root root 0 Jul 29 14:54 ./ologgerd/init/lccn0
-rw-r--r--. 1 root root 5 Dec 1 08:35 ./ologgerd/init/lccn0.pid
-rw-r--r--. 1 root root 0 Jul 29 14:52 ./osysmond/init/lccn0
-rw-r--r--. 1 root root 5 Dec 1 08:35 ./osysmond/init/lccn0.pid

解决方法:
手动修改pid 文件权限后,重启crs 恢复正常

Oracle 12c/19c ADR trace dest disk busy (100%) when ‘ls’ trace files

$
0
0

最近遇到几次故障升级oracle 12c后,相同的硬件有几次instance crash同时伴有LGWR 核心进程N seconds not move现象,OSW中vmstat ‘B’列会伴有突然大量的blocked(通常是I/O)问题,mpstat/iostat 显示$ORACLE_BASE所在本地文件系统出现90-100% busy现象, ps 显示LGWR和一些FG进程同时在等待相同事OS Kernel function address。

环境Oracle 12C r2 2nodes-RAC on HPUX 11.31,  从12c开始确实从ADR trace目录中比11G前trace文件数有所增加,尤其还有些潜在BUG如《Oracle12c R2注意事项: 又一个BUG 生成大量的trace 含 kjshash() kjqghd()》中记录过1天产生近90万trace, 如文件系统inode使用率过,过多的小文件在同一目录中是会导致文件检索效率变差,Veritas建议将单个VxFS目录中的文件数限制为100,000个文件。

当前出现oracle ADR所在本地disk busy的inode使用并不高,前且统计在DB trace目录1600个文件时ls 也有近4分钟时间, ls同时会出现 disk busy 100%, tusc ls进程也基本是花在getdents调用上。当前是找出哪个进程导致阶段性disk busy? 如何解决disk busy?

racle@anbob2:/home/oracle> sar -d 1 3                                                                                                                                                 
HP-UX anbob2 B.11.31 U ia64    12/03/20

18:07:55   device   %busy   avque   r+w/s  blks/s  avwait  avserv
18:07:56    disk4   98.02    0.50     240    3784    0.00    4.11   # local_vg oracle lv
            disk5    0.00    0.50       1      16    0.00    0.21
         disk3054    0.00    0.50       4      14    0.00    0.07
         disk3022    0.00    0.50      20    1576    0.00    0.17

Glance查看

#按文件系统
Glance 12.02.008                14:51:35   anbob2      ia64                                   Current Avg  High
---------------------------------------------------------------------------------------------------------------
CPU  Util   S    SU           UW                                                              | 16%   18%   23%
Disk Util   F                                                                           F     | 97%   99%  100%
Mem  Util   S                  SU                                    UF   F                   | 53%   53%   53%
Networkil   U                                                          UR                     | 51%   51%   51%
---------------------------------------------------------------------------------------------------------------
                                                                  IO BY FILE SYSTEM                Users=   15
Idx   File System            Device               Type     Logl IO     Phys IO
---------------------------------------------------------------------------------------------------------------
   1 /                       /dev/vg00/lvol3      vxfs      na/   na   0.1/  1.0
   2 /stand                  /dev/vg00/lvol1      vxfs      na/   na   0.1/  0.7
   3 /var                    /dev/vg00/lvol8      vxfs      na/   na   0.1/  5.7
   4 /usr                    /dev/vg00/lvol7      vxfs      na/   na   0.5/  0.8
   5 /topteact               /dev/.../lv_topteact vxfs      na/   na   0.0/  0.0
   6 /tmp                    /dev/vg00/lvol6      vxfs      na/   na   0.7/  0.7
   9 /ptfs                   /dev/.../fslv_ptfs   vxfs      na/   na   0.0/  0.0
  10 /patrol                 /dev/.../fslv_patrol vxfs      na/   na   0.0/  1.2
  11 /oracle                 /dev/.../fslv_oracle vxfs      na/   na 246.1/275.5


#按disk排序
glance u
  Glance 12.02.008                14:51:51   anbob2      ia64                                   Current Avg  High
---------------------------------------------------------------------------------------------------------------
CPU  Util   S     SU               UW                                                         | 20%   18%   23%
Disk Util   F                                                                           F     | 97%   99%  100%
Mem  Util   S                  SU                                    UF   F                   | 53%   53%   53%
Networkil   U                                                          UR                     | 51%   51%   51%
---------------------------------------------------------------------------------------------------------------
                                                                      IO BY DISK                   Users=   15
                                                      Logl       Phys       Serv
Idx   Device        Util    Qlen       KB/Sec          IO         IO        Time
---------------------------------------------------------------------------------------------------------------
   1 disk5_p2    0.0/0.1     0.0    13.0/  108.2    na/   na   1.1/  9.6    0.00
   2 disk4       7.1/100     0.0    2087/   2367    na/   na 243.4/277.3    4.03
   3 disk3059    1.5/1.3     0.0   14155/  14388    na/   na 123.0/121.6    0.45
   4 disk3054    0.1/0.0     0.0     4.4/   12.6    na/   na   3.2/  3.8    0.58
   5 disk3020    0.9/0.8     0.0   150.7/  700.9    na/   na  17.6/ 38.3    0.54
# 按IO进程排序
glance o 
  Glance 12.02.008                17:53:19   anbob2      ia64                                   Current Avg  High
---------------------------------------------------------------------------------------------------------------
CPU  Util   S    SU         UW                                                                | 14%   14%   14%
Disk Util   F                                                                             F   | 98%   99%   99%
Mem  Util   S                  SU                                      UF   F                 | 54%   54%   54%
Networkil   U                                                          UR                     | 51%   51%   51%
---------------------------------------------------------------------------------------------------------------
                      INTERESTING PROCESS THRESHOLD OPTIONS          
                         
Display processes with resource usage:              Current Thresholds:

      CPU Utilization             >                 (1.0                %      )
      Disk I/O Rate               >                 (1.0                IOs/sec)
      Resident Set Size           >                 (20                 Mbytes )
      Virtual Set Size            >                 (500                Mbytes )
      User name                   =                 (all                       )
      Program name                =                 (all                       )
      TTY path name               =                 (all                       )
      Use match logic (and/or)    :                 (or                        )
      Sort key (name/cpu/disk/rss): disk            (disk                      )

      Glance started or last reset: 12/03/2020  17:53:12  
      Current refresh interval        : 5 seconds  


Glance 12.02.008                18:04:55   anbob2      ia64                                   Current Avg  High
---------------------------------------------------------------------------------------------------------------
CPU  Util   S   SU      UW                                                                    | 11%   13%   18%
Disk Util   F                                                                              F  | 99%   78%  100%
Mem  Util   S                  SU                                      UF   F                 | 54%   54%   54%
Networkil   U                                                          UR                     | 51%   51%   52%
---------------------------------------------------------------------------------------------------------------
                                                                     PROCESS LIST                  Users=   12
                         User       CPU %   Thrd   Disk        Memory     Block
Process Name         PID Name    (9600% max) Cnt IO rate    RSS      VSS   On
---------------------------------------------------------------------------------------------------------------
pmgreader          20491 itmuser       0.3     1  225.1    4.6mb    8.5mb    IO    <<<<<<<
ora_lg00_tbc        6511 oracle        1.3     1   63.8   34.2mb   47.9mb SLEEP 
replicat           15014 oracle        0.1     4   20.7   81.6mb    135mb SLEEP 
oracletbcse2        9258 oracle        0.5     1   18.0   42.2mb   72.6mb  PIPE 
oracletbcse2       15113 oracle        0.1     1   16.5   34.5mb   51.3mb  PIPE 

本地oracle_base在lv_oracle上/oracle ,下层为disk4, 2块物理机械盘, 所以在IOPS在240时 disk busy 超过了90%. 当然使用glance也找到了导致间断性disk busy的进程是本地部署的监控应用pmgreader在读oracle ADR trace目录中的alert日志。停止该监控后不再出现disk busy. 但是问题的原根本原因在为什么ls 1600多个文件的目录会出现这么大的性能影响?

去年在《Troubleshooting Slower IO Performance on Veritas for 11.2.0.4 compared 10gR2 on RAW device after RMAN migrate》案例中遇到过一个因为数据库迁移后出现的IO慢性能问题案例, 当时就是因为使用的是veritas的Vxfs,  是因为vxfs中的碎片太多导致。

当文件系统<2TB的文件系统,Vxfs默认使用1K block size,这也是oracle binary directory建议的块大小, VxFS 有点像oracle的segment 结构也是block > extents. 有个经验值当<8k的extents 占用total extents 5%时说明当前的VxFS是糟糕的。

oracle@anbob2:/home/oracle> df -o s /oracle/app/oracle/diag/rdbms/prianbob/anbob2/trace/
/oracle                (/dev/localvg/fslv_oracle) :
Free Extents by Size
          1:      67999            2:      81451            4:      83073  
          8:     135547           16:     121548           32:     105307  
         64:      87917          128:      84479          256:      56530  
        512:      32626         1024:      15477         2048:       4959  
       4096:        715         8192:         79        16384:          3  
      32768:          3        65536:          1       131072:          0  
     262144:          1       524288:          1      1048576:          1  
    2097152:          2      4194304:          2      8388608:          1  
   16777216:          0     33554432:          0     67108864:          0  
  134217728:          0    268435456:          0    536870912:          0  
 1073741824:          0   2147483648:          0  
 

检查文件系统碎片

 oracle@anbob2:/home/oracle>  vxfsstat -b /oracle

buffer cache statistics
   208512 Kbyte current    4221440 maximum
88821047312 lookups            95.42% hit rate
     5501 sec recycle age [not limited by maximum]
	 
oracle@anbob2:/opt/VRTS/bin> ls -l /oracle/app/oracle/diag/rdbms/prianbob/anbob2/trace/alert*.log
-rw-r-----   1 oracle     asmadmin   18217303 Dec 10 16:31 /oracle/app/oracle/diag/rdbms/prianbob/anbob2/trace/alert_anbob2.log
 
oracle@anbob2:/opt/VRTS/bin> ./fsmap -a /oracle/app/oracle/diag/rdbms/prianbob/anbob2/trace/alert*.log|grep -v Volume |awk '{print  $4}'|sort |uniq -c| sort -nk2
1055 1024
  76 2048
  14 3072
  14 4096
   5 5120
   4 6144
   2 7168
  15 8192
   2 9216
   3 11264
   1 13312
   1 15360
   7 16384
   1 22528
   1 31744
   3 32768
   1 35840
   1 65536
   1 75776
   1 81920
   1 197632
   1 206848
   1 262144
   1 312320
   1 314368
   1 393216
   1 524288
   1 676864
   1 698368
   1 779264
   1 929792
   2 1048576
   1 1319936
   3 2097152
   1 3179520

如果这个目录过去可能因为oracle的bug出现过几十万的trace file,导致该目录的VxFS metadata很大,如果后来及时删了,但未整理碎片,可能metadata依旧不会回收那ls 时依旧会需要加载这么大的metadata(no sure),类似oracle 的Full table scan,但是oracle 有buffer cache可以减少物理读, VxFS 有吗? 后来咨询了HP原厂,有的那就是vxfs_bc_bufhwm,发现这个主机确实过去的集成商不知道出于什么原因调整过,而且调的参数值是不合理的,默认应该是0,表示自动调整,vxfs_bc_bufhwm 显示指定了值(下面是恢复后的默认值)。

 oracle@anbob2:/home/oracle> kctune |grep vxfs
vxfs_bc_bufhwm                               0  0             Immed
vxfs_ifree_timelag                          -1  -1            Immed

NAME     vxfs_bc_bufhwm – VxFS buffer cache high water mark(determines the VxFS
buffer cache size)
SYNOPSIS
/usr/bin/kctune -s vxfs_bc_bufhwm={maximum size of buffer cache}
VALUE
Specify an integer value.
Minimum
6144 KB
Maximum
90% of kernel memory.
Default
0

DESCRIPTION
VxFS maintains a buffer cache in the kernel for frequently accessed
file system metadata in addition to the HP-UX kernel buffer cache that
caches the file data.  vxfs_bc_bufhwm tunable parameter determines the
size of the VxFS buffer cache (the maximum amount of memory that can
be used to cache VxFS metadata).
// The maximum size of the metadata buffer cache is set (auto-tuned) at boot time based on system memory size, provided that the value of vxfs_bc_bufhwm is set to zero (default).
Like with the tunable vx_ninode, a large metadata buffer cache can help improve file system performance, especially during metadata-intensive loads (stat, create, remove, link, lookup operations).

NOTES
Use the vxfsstat command to monitor buffer cache statistics and inode cache usage. See the vxfsstat(1M) manual page.
Setting the vxfs_bc_bufhwm value too low can result in a system hang. Set the value of vxfs_bc_bufhwm to 5% or more of the system’s total physical memory if the system has 8 GB or less physical memory. Set the value of vxfs_bc_bufhwm to 2% or more of the system’s total physical memory if the system has more than 8 GB of physical memory. The higher the physical memory of the system, the lower you can set vxfs_bc_bufhwm. You can set vxfs_bc_bufhwm to as low as 0.5% of the system’s total physical memory if the system has much more than 8 GB of memory.
EXAMPLES
The following command sets the maximum of size of buffer cache at 300000:

# kctune -s vxfs_bc_bufhwm=300000
WARNINGS
Incorrectly tunning a parameter may adversely affect system performance. See the Storage Foundation Administrator’s Guide for more information about tuning parameters.
VxFS kernel tunable parameters are release specific. This parameter may be removed or the default value and usage may change in future releases. See the Storage Foundation Release Notes for information about changes to parameters, if any.

解决方案
尝试调整内核参数

/usr/bin/kctune -s vxfs_bc_bufhwm=0

oracle@anbob2:/home/oracle>  vxfsstat -b /oracle
buffer cache statistics
   688512 Kbyte current    4221440 maximum
88824047314 lookups            95.42% hit rate
     5501 sec recycle age [not limited by maximum]

再1次ls 做物理读,但第2次就恢复了正常,秒出结果。

另外一种解决方法是把trace目录rename,新创建trace目录再把文件复制回原目录。注意需要实例停止情况下做。

Oracle19c手动清理PDB SYSAUX中的大对象如WRI$_ADV_OBJECTS (ORA-65040)

$
0
0

近期一客户19c RAC CDB数据库的SYSAUX表空间增长超大,分析原因为Optimizer statistics advisor特性导致的WRI$_ADV_OBJECTS对象记录数变多, 以下为清理方法。

1, 找出最大对象

SQL> set lines 120
SQL> col occupant_name format a30
SQL> select occupant_name,space_usage_kbytes from v$sysaux_occupants order by space_usage_kbytes desc;

或
prompt
prompt List of TOP 10 largest objects in SYSTEM AND SYSAUX TABLESPACE:
prompt  


select * from (
select tablespace_name,topseg_seg_owner,topseg_segment_name,segment_type,mb,partitions, row_number() over(partition by tablespace_name order by mb desc) rn from (
select 
                tablespace_name, 
                owner topseg_seg_owner, 
                segment_name topseg_segment_name, 
                --partition_name, 
                segment_type, 
                round(SUM(bytes/1048576)) MB, 
    case when count(*) >= 1 then count(*) else null end partitions 
        from dba_segments 
        where upper(tablespace_name) in ('SYSTEM','SYSAUX')  -- tablespace name   
  group by 
                tablespace_name, 
                owner, 
                segment_name, 
                segment_type ))
     where rn<=10;

这个客户发现是Sm/advisor和最大对象为Wri$_adv_objects ,因为在12.2中引入了一个新功能:优化器统计顾问。 优化器统计信息顾问每天在“维护”窗口中运行,多次auto_stats_advisor_task,并占用大量sysaux表空间。

2,统计记录数

SQL> col task_name format a35
SQL> select task_name, count(*) cnt from dba_advisor_objects group by task_name order by cnt desc;

3, 手动清理 如WRI$_ADV_OBJECTS

-- 删除Statistics Advisor 任务
DECLARE
v_tname VARCHAR2(32767);
BEGIN
v_tname := 'AUTO_STATS_ADVISOR_TASK';
DBMS_STATS.DROP_ADVISOR_TASK(v_tname);
END;
/

Note:
1, 如果遇到错误:Ora-20001:statistics advisor:invalid Task Name for the current user
执行

SQL> EXEC DBMS_STATS.INIT_PACKAGE();

2, 如果 WRI$_ADV_OBJECTS 记录过多,delete以上会占用较大undo,可以把想要的数据存储在临时表,truncate table WRI$_ADV_OBJECTS,再insert回来。

–删除任务之后,重组表和所有索引

SQL> ALTER TABLE WRI$_ADV_OBJECTS MOVE;
SQL> ALTER INDEX WRI$_ADV_OBJECTS_IDX_01 REBUILD;
SQL> ALTER INDEX WRI$_ADV_OBJECTS_PK REBUILD;

3, 如果在CDB中,以上操作没有任何问题,但是在PDB中MOVE表可能会有如下ORA-65040错误

SQL> ALTER TABLE WRI$_ADV_OBJECTS MOVE;
ALTER TABLE WRI$_ADV_OBJECTS MOVE
            *
ERROR at line 1:
ORA-65040: operation not allowed from within a pluggable database

SQL> ho oerr ora 65040
65040, 00000, "operation not allowed from within a pluggable database"
// *Cause:  An operation was attempted that can only be performed in the root
//          or application root container.
// *Action: Switch to the root or application root container to perform the
//          operation.
//

解决方法有2种:
1,_oracle_scripts参数

SQL> alter session set "_oracle_script"=true;
Session altered.

SQL> ALTER TABLE WRI$_ADV_OBJECTS MOVE;
Table altered.

2,dbms_pdb.exec_as_oracle_script

SQL> exec dbms_pdb.exec_as_oracle_script('alter table sys.WRI$_ADV_OBJECTS move');
PL/SQL procedure successfully completed.

4. 为了减少advisor存储,可以减少保留期限

-确认当前设定的保持期间
select task_name, parameter_name, parameter_value FROM DBA_ADVISOR_PARAMETERS
where task_name='AUTO_STATS_ADVISOR_TASK' and PARAMETER_NAME like '%EXPIRE%';

-- 修改设定的保持期间,如历史数据的保存时间为15天:

BEGIN
 DBMS_SQLTUNE.SET_TUNING_TASK_PARAMETER (
  task_name => 'AUTO_STATS_ADVISOR_TASK'
 , parameter => 'EXECUTION_DAYS_TO_EXPIRE'
 , value => 15
);
END;
/

Note:
但是需要注意12.2中的Bug 26764561 AUTO_STATS_ADVISOR_TASK Not Purging Even Though Setting EXECUTION_DAYS_TO_EXPIRE (Doc ID 2615851.1),
该配置在CDB和不同PDB中相互独立。

5,禁用AUTO_STATS_ADVISOR_TASK

如果觉的这ADVISOR实在没用,可以考虑禁用,但是12c-20c默认需要先安装一bug 26749785 patch增加AUTO_STATS_ADVISOR_TASK控制,注意这不是bug,只是增强功能。在安装该patch前(或21.1版本前),无法使用以下功能。

SQL> exec dbms_stats.set_global_prefs('AUTO_STATS_ADVISOR_TASK','FALSE');

SQL> select dbms_stats.get_prefs('AUTO_STATS_ADVISOR_TASK') from dual;
DBMS_STATS.GET_PREFS('AUTO_STATS_ADVISOR_TASK')
--------------------------------------------------------------------------------
FALSE

或者使用

declare
  filter1 clob;
begin
  filter1 := dbms_stats.configure_advisor_rule_filter('AUTO_STATS_ADVISOR_TASK',
                                                      'EXECUTE',
                                                      NULL,
                                                      'DISABLE');
END;
/

References SYSAUX Tablespace Grows Rapidly After Upgrading Database to 12.2.0.1 or Above Due To Statistics Advisor (Doc ID 2305512.1)

Go语言(GO lang)连接Oracle Database使用godror

$
0
0

GO lang通用的、跨平台的、开源的编程语言,(Started at Google in 2007)GoLANG在高并发支持非常优秀,相比python更快,godror使用ODPI-C(用于C的Oracle数据库编程接口)为Oracle数据库实现了Go数据库/sql驱动程序, 在中文支持方面非常不错, 这里记录Go连接oracle数据库的方法, GO for Windows 开发环境配置.

1,GO 安装

— for linux

[root@localhost ~]# wget https://golang.google.cn/dl/go1.15.6.linux-amd64.tar.gz
--2020-12-18 19:43:59--  https://golang.google.cn/dl/go1.15.6.linux-amd64.tar.gz
Resolving golang.google.cn (golang.google.cn)... 203.208.41.34
Connecting to golang.google.cn (golang.google.cn)|203.208.41.34|:443... connected.
HTTP request sent, awaiting response... 302 Found
Location: https://dl.google.com/go/go1.15.6.linux-amd64.tar.gz [following]
--2020-12-18 19:43:59--  https://dl.google.com/go/go1.15.6.linux-amd64.tar.gz
Resolving dl.google.com (dl.google.com)... 203.208.41.65
Connecting to dl.google.com (dl.google.com)|203.208.41.65|:443... connected.
HTTP request sent, awaiting response... 200 OK
Length: 120951514 (115M) [application/octet-stream]
Saving to: ‘go1.15.6.linux-amd64.tar.gz’

100%[====================================================================================================================>] 120,951,514 7.70MB/s   in 16s

2020-12-18 19:44:16 (7.12 MB/s) - ‘go1.15.6.linux-amd64.tar.gz’ saved [120951514/120951514]

[root@localhost ~]# tar -C /usr/local -xzf go1.15.6.linux-amd64.tar.gz
[root@localhost ~]# vi .bash_profile

export PATH=$PATH:/usr/local/go/bin

[root@localhost ~]# . .bash_profile
[root@localhost ~]# which go
/usr/local/go/bin/go
[root@localhost ~]# go version
go version go1.15.6 linux/amd64

— for Windows 10
下载
https://golang.google.cn/doc/install?download=go1.15.6.windows-amd64.msi

C:\Users\zhang>go version
go version go1.15.6 windows/amd64

2, 安装Oracle Instant Client
虽然Oracle客户端库不需要编译,他们都 在运行时需要的。从https://www.oracle.com/database/technologies/instant-client/downloads.html下载免费的Basic或Basic Light软件包 。

# oracle basic client
https://download.oracle.com/otn_software/nt/instantclient/19900/instantclient-basic-windows.x64-19.9.0.0.0dbru.zip
# oracle jdk client
https://download.oracle.com/otn_software/nt/instantclient/19900/instantclient-sdk-windows.x64-19.9.0.0.0dbru.zip

合并到D:\orainstantclient_19_9, 改变PATH=D:\orainstantclient_19_9;$PATH 环境变量

/drives/d/orainstantclient_19_9  ls -l
total 118940
-r-xr-x---    1 weejar   UsersGrp      5903 Dec 19 09:30 BASIC_LICENSE
-r-xr-x---    1 weejar   UsersGrp      1725 Dec 19 09:30 BASIC_README
-r-xr-x---    1 weejar   UsersGrp      1238 Dec 19 09:31 SDK_LICENSE
-r-xr-x---    1 weejar   UsersGrp      5903 Dec 19 09:31 SDK_README
-r-xr-x---    1 weejar   UsersGrp     28672 Dec 19 09:30 adrci.exe
-r-xr-x---    1 weejar   UsersGrp     38496 Dec 19 09:30 adrci.sym
-r-xr-x---    1 weejar   UsersGrp     72704 Dec 19 09:30 genezi.exe
-r-xr-x---    1 weejar   UsersGrp     70112 Dec 19 09:30 genezi.sym
-r-xr-x---    1 weejar   UsersGrp    807424 Dec 19 09:30 oci.dll
-r-xr-x---    1 weejar   UsersGrp    784832 Dec 19 09:30 oci.sym
-r-xr-x---    1 weejar   UsersGrp    182272 Dec 19 09:30 ocijdbc19.dll
-r-xr-x---    1 weejar   UsersGrp     57264 Dec 19 09:30 ocijdbc19.sym
-r-xr-x---    1 weejar   UsersGrp    610816 Dec 19 09:30 ociw32.dll
-r-xr-x---    1 weejar   UsersGrp    111208 Dec 19 09:30 ociw32.sym
-r-xr-x---    1 weejar   UsersGrp   4406794 Dec 19 09:30 ojdbc8.jar
-r-xr-x---    1 weejar   UsersGrp     88576 Dec 19 09:30 oramysql19.dll
-r-xr-x---    1 weejar   UsersGrp     55824 Dec 19 09:30 oramysql19.sym
-r-xr-x---    1 weejar   UsersGrp   4761600 Dec 19 09:30 orannzsbb19.dll
-r-xr-x---    1 weejar   UsersGrp   2353504 Dec 19 09:30 orannzsbb19.sym
-r-xr-x---    1 weejar   UsersGrp   1178112 Dec 19 09:30 oraocci19.dll
-r-xr-x---    1 weejar   UsersGrp   1374224 Dec 19 09:30 oraocci19.sym
-r-xr-x---    1 weejar   UsersGrp   1202176 Dec 19 09:30 oraocci19d.dll
-r-xr-x---    1 weejar   UsersGrp   1314040 Dec 19 09:30 oraocci19d.sym
-r-xr-x---    1 weejar   UsersGrp 206456320 Dec 19 09:30 oraociei19.dll
-r-xr-x---    1 weejar   UsersGrp  15138072 Dec 19 09:30 oraociei19.sym
-r-xr-x---    1 weejar   UsersGrp    288768 Dec 19 09:30 oraons.dll
-r-xr-x---    1 weejar   UsersGrp    236544 Dec 19 09:30 orasql19.dll
-r-xr-x---    1 weejar   UsersGrp     65400 Dec 19 09:30 orasql19.sym
dr-xr-x---    1 weejar   UsersGrp         0 Dec 19 09:31 sdk
-r-xr-x---    1 weejar   UsersGrp   1686472 Dec 19 09:30 ucp.jar
-r-xr-x---    1 weejar   UsersGrp     28672 Dec 19 09:30 uidrvci.exe
-r-xr-x---    1 weejar   UsersGrp     38496 Dec 19 09:30 uidrvci.sym
dr-xr-x---    1 weejar   UsersGrp         0 Dec 19 09:30 vc14
-r-xr-x---    1 weejar   UsersGrp     74263 Dec 19 09:30 xstreams.jar

3,安装 mingw-w64
Windows上的GCC编译. Note that Windows may need some newer gcc (mingw-w64 with gcc 7.2.0).
下载
https://sourceforge.net/projects/mingw-w64/files/ 选择x86_64-posix-seh 如:选择8.1 posix-seh

下载后解压到如D:\mingw64, PATH环境变量增加 D:\mingw64\bin。

4,安装Godror驱动程序
按照GitHub上goracle存储库中的说明进行操作:

$ go get github.com/godror/godror

等待成功后无输出, 用户手册 https://godror.github.io/godror/doc/installation.html

5, 准备oracle database
这里使用VM中的 Oracle 19c。

6,GO代码连接Oracle数据库

package main
  
import (
    "fmt"
    "database/sql"
    _ "github.com/godror/godror"
)

const (
    host        = "192.168.56.102"
    port        = 1521
    user        = "anbob"
    sqlpassword = "anbob"
    dbname      = "pdb1"
)
  
func main(){
    // 用户名/密码@IP:端口/实例名
	oralInfo := fmt.Sprintf("%s/%s@%s:%d/%s", user, sqlpassword, host, port, dbname)
	fmt.Println(oralInfo)
    db, err := sql.Open("godror", oralInfo)
	//db, err := sql.Open("godror", "anbob/anbob@192.168.56.102/pdb1")
    
    fmt.Println("连接成功!")

    err = db.Ping()

    if err != nil {
        fmt.Println(err)
        return
    }
    defer db.Close()
      
      
    rows,err := db.Query("select banner from v$version")
    if err != nil {
        fmt.Println("Error running query")
        fmt.Println(err)
        return
    }
    cols, _ := rows.Columns()

    fmt.Printf("Result columns : %s\n", cols)
    defer rows.Close()
  
    var dbVersion string
    for rows.Next() {
  
        rows.Scan(&dbVersion)
    }
    fmt.Printf("数据库版本 : %s\n", dbVersion)
}

执行

D:\code\gotest>go run connectora.go
anbob/anbob@192.168.56.102:1521/pdb1
连接成功!
Result columns : [BANNER]
数据库版本 : Oracle Database 19c Enterprise Edition Release 19.0.0.0.0 - Production

D:\code\gotest>
D:\code\gotest>go build connectora.go

D:\code\gotest>connectora.exe
anbob/anbob@192.168.56.102:1521/pdb1
连接成功!
Result columns : [BANNER]
数据库版本 : Oracle Database 19c Enterprise Edition Release 19.0.0.0.0 - Production

— enjoy —


Go语言(GO lang)连接PostgreSQL Database使用pq

$
0
0

Go语言(GO lang)连接Oracle Database使用godror》上篇以后,这里继续测试使用GO Lang操作PostGreSQL, 使用pq驱动。

1,安装posgresql go驱动

# go get github.com/lib/pq

2, 准备postgresql 表

sdbo=# select version()
sdbo-# ;
 PostgreSQL 13.1, compiled by Visual C++ build 1914, 64-bit

weejar=# \c sdbo
您现在已经连接到数据库 "sdbo",用户 "weejar".
sdbo=# create table sdbo_department(dep_id int,dep_name varchar(30));
CREATE TABLE
sdbo=#
sdbo=# \dt+
 public   | sdbo_department | 数据表 | weejar | permanent   | 0 bytes |

sdbo=# \d sdbo_department
 dep_id   | integer               |          |        |
 dep_name | character varying(30) |          |        |

3, Go Lang代码

package main

import (
	"database/sql"
	"fmt"
	"log"
	_ "github.com/lib/pq"
)

const (
	host     = "localhost"
	port     = 5432
	user     = "weejar"
	password = "weejar"
	dbname   = "sdbo"
)

func connectDB() *sql.DB{
	psqlInfo := fmt.Sprintf("host=%s port=%d user=%s "+
		"password=%s dbname=%s sslmode=disable",
		host, port, user, password, dbname)

	db, err := sql.Open("postgres", psqlInfo)
	if err != nil {
		panic(err)
	}

	err = db.Ping()
	if err != nil {
		panic(err)
	}
	fmt.Println("Successfully connected!")
	return db
}

func insertUser(db *sql.DB)  {
	stmt,err := db.Prepare("insert into sdbo_department(dep_id,dep_name) values($1,$2)")
	if err != nil {
		log.Fatal(err)
	}
	_,err = stmt.Exec(1,"mgr")
	
	if err != nil {
		log.Fatal(err)
	}else {
			fmt.Println("insert into sdbo_department success!")
	}

}

func query(db *sql.DB){
	var id,name string
    

	rows,err:=db.Query(" select * from sdbo_department where dep_id=$1","1")

	if err!= nil{
		fmt.Println(err)
	}
	defer rows.Close()

	for rows.Next(){
		err:= rows.Scan(&id,&name)

		if err!= nil{
			fmt.Println(err)
		}
	}

	err = rows.Err()
	if err!= nil{
		fmt.Println(err)
	}

	fmt.Println(id,name)
}

func main()  {
	db:=connectDB()
	insertUser(db)
	query(db)

}

4, 执行 GO 代码

D:\code\gotest>go run connectpg.go
Successfully connected!
insert into sdbo_department success!
1 mgr

— enjoy —

Oracle数据库当遇到存储磁盘坏道时的处理(DBV-00102)

$
0
0

数据库环境有时会因为硬件磁盘问题导致数据不可读,而硬盘坏道”便是这其中最常见的问题, 当出现因为磁盘坏道里更加棘手,无法移动或跳过,更甚至因为有坏盘在换盘后RAID重组出现文件系统勘误导致文件为0bytes,增加恢复难度,例如使用dbv 检查时会出现如下报错:

$ dbv file=/oracle/oradata/anbob_01.dbf

DBVERIFY: Release 10.2.0.4.0 - Production on Mon Dec 28 15:41:24 2020
Copyright (c) 1982, 2007, Oracle.  All rights reserved.
DBVERIFY - Verification starting : FILE = /oracle/oradata/anbob_01.dbf
DBV-00102: File I/O error on FILE (/oracle/oradata/anbob_01.dbf) during verification read operation (-2)

$ cp /oracle/oradata/anbob_01.dbf  /oracle/oradata/anbob_01.dbf_bak
cp: anbob_01.dbf : I/O error

Note:
可见文件系统复制都是报错。

出现这类问题时如果数据库文件在文件系统,可以使用dd或其它工具重组数据文件,跳过坏道数据块,重建坏道数据库涉及的对象;如果数据文件在ASM中处理相对麻烦,也是可以脚本拼抽数据文件从ASM到文件系统,或AMDU, 如果单个数据文件比较到,坏的ASM 坏比较少,可以深度bbed修改ASM METADATA指定原AU到新空白AU 位置欺骗oracle,然后尽快重建数据库。

可以自己写脚本试探数据文件的坏道范围, 文件系统的dd 读坏道时

$ dd if=/oracle/oradata/anbob_01.dbf of=/dev/null bs=8192 iseek=142843 count=100000
read: I/O error
0+0 records in
0+0 records out

$ dd if=/oracle/oradata/anbob_01.dbf of=/dev/null bs=8192 iseek=142933 count=100000
100000+0 records in
100000+0 records out

从dba_extents 确认范围内数据库对象, 然后dd 组装新数据文件,rename datafile. recover datafile有可能会出现

SQL> SQL> recover datafile 36;
ORA-00283: recovery session canceled due to errors
ORA-12801: error signaled in parallel query server P004
ORA-00600: internal error code, arguments: [3020], [36], [142864], [151137808],
[], [], [], []
ORA-10567: Redo is inconsistent with data block 

SQL> recover datafile 36 allow 1 corruption;
Media recovery complete.

SQL> alter database datafile 36 online;
Database altered.

当然如果现在validate datafile 数据文件中跳过的block 会查出”ALL ZERO”的勘误块, 也可以不用管后面数据库会reuse时重新reformat block, 但是当前rman默认备份可能会因发现corruptd block而中断,需要特殊配置。 也可以手动造数据fill datafile 尝试reformat block. https://www.anbob.com/archives/2573.html 有相关脚本。

SQL> select * from v$database_block_corruption;

     FILE#     BLOCK#     BLOCKS CORRUPTION_CHANGE# CORRUPTIO
---------- ---------- ---------- ------------------ ---------
        36     142864          1         1.2845E+10 LOGICAL
        36     142832         32                  0 ALL ZERO
        36     142865         58                  0 ALL ZERO

如果坏道发生成ASM disk上,确认位置要麻烦一些, 需要从X$KFFXP VIEW确认决对位置,X$KFFXP (metadata, file extent pointers),字段含义

GROUP_KFFXP       diskgroup number (1 - 63) ASM disk group number. Join with v$asm_disk and v$asm_diskgroup
NUMBER_KFFXP      file number for the extent ASM file number. Join with v$asm_file and v$asm_alias
COMPOUND_KFFXP    (group_kffxp << 24) + file # File identifier. Join with compound_index in v$asm_file
INCARN_KFFXP      file incarnation number File incarnation id. Join with incarnation in v$asm_file
PXN_KFFXP         physical extent number  Extent number per file
XNUM_KFFXP        extent number bit 31 set if indirect Logical extent number per file (mirrored extents have the same value)
LXN_KFFXP         logical extent number 0,1 used to identify primary/mirror extent,2 identifies file header allocation unit (hypothesis) used in the query such that we go after only the primary extents, not secondary extents 
DISK_KFFXP        disk on which AU is located  Disk number where the extent is allocated.Join with v$asm_disk Relative position of the allocation unit from the beginning of the disk. 
AU_KFFXP          AU number on disk of AU allocation unit size (1 MB) in v$asm_diskgroup
CHK_KFFXP         unknown 可能是范围为[0-256]的某种校验值
SIZE_KFFXP        size_kffxp is used such that we account for variable sized extents. sum(size_kffxp) provides the number of AUs that are on that disk.

# 查询映射关系

set linesize 140 pagesize 1400
col "FILE NAME" format a40
set head on
select NAME         "FILE NAME",
       NUMBER_KFFXP "FILE NUMBER",
       XNUM_KFFXP   "EXTENT NUMBER",
       DISK_KFFXP   "DISK NUMBER",
       AU_KFFXP     "AU NUMBER",
       SIZE_KFFXP   "NUMBER of AUs"
  from x$kffxp, v$asm_alias
 where GROUP_KFFXP = GROUP_NUMBER
   and NUMBER_KFFXP = FILE_NUMBER
   and system_created = 'Y'
   and lxn_kffxp = 0
 order by name;


12c开始还可以使用asmcmd 的mapau和mapextent查看映射关系。 更多内容可以查看ASM INTERNAL,

对于有坏道的数据文件可以搞到文件系统,组装后再搞回ASM, 也可以只修改ASM metadata指针到一个其它AU,欺骗oracle, 但是RB后可能还有有问题,因此需要及时重建数据库。

定位可以参考 如何在asm上定位数据块

select INCARN_KFFXP,XNUM_KFFXP,LXN_KFFXP,DISK_KFFXP,AU_KFFXP,'dd if='||b.path||' of=/tmp/file'||NUMBER_KFFXP||'.dbf'||' conv=notrunc bs=1048576 skip='||AU_KFFXP||' seek='||XNUM_KFFXP||' count=1' 
from x$kffxp a,
v$asm_disk b  wHere inst_id=1 
and GROUP_KFFXP=5 
AND NUMBER_KFFXP=256  
and XNUM_KFFXP=(ceil((8192*1389)/1048576)-1) --start 0
and a.GROUP_KFFXP=b.GROUP_NUMBER and a.DISK_KFFXP=b.DISK_NUMBER and LXN_KFFXP=0
order by XNUM_KFFXP,LXN_KFFXP;

INCARN_KFFXP XNUM_KFFXP  LXN_KFFXP DISK_KFFXP   AU_KFFXP 'DDIF='||B.PATH||'OF=/TMP/FILE'||NUMBER_KFFXP||'.DBF'||'CONV=NOTRUNCBS=1048576SKIP='||AU_KFFXP||'SEEK='||XNUM_KFFXP||'COUNT=1'
------------ ---------- ---------- ---------- ---------- -----------------------------------------------------------------------------------------------------------------------------------------------------------------------------------------------------------------------------------------------------------------------------------------------------------------------------------------------------------------------------------------------------------------------------------------------------------
  1057656433         10          0          1         24 dd if=/dev/asm-diski of=/tmp/file256.dbf conv=notrunc bs=1048576 skip=24 seek=10 count=1
  

查找file 1 block 1(FileDirectory blk 1 AU num )

$ kfed read /dev/asm-diskh|grep -E "f1b1|ausize"
kfdhdb.ausize:                  1048576 ; 0x0bc: 0x00100000
kfdhdb.f1b1locn:                      2 ; 0x0d4: 0x00000002 #非0值

$ kfed read /dev/asm-diskh aun=2 blkn=1|head -10
kfbh.endian:                          1 ; 0x000: 0x01
kfbh.hard:                          130 ; 0x001: 0x82
kfbh.type:                            4 ; 0x002: KFBTYP_FILEDIR
kfbh.datfmt:                          1 ; 0x003: 0x01
kfbh.block.blk:                       1 ; 0x004: blk=1
kfbh.block.obj:                       1 ; 0x008: file=1
kfbh.check:                  4176897006 ; 0x00c: 0xf8f663ee
kfbh.fcn.base:                      261 ; 0x010: 0x00000105
kfbh.fcn.wrap:                        0 ; 0x014: 0x00000000
kfbh.spare1:                          0 ; 0x018: 0x00000000

根据file Directory查找disk Directory

$  kfed read /dev/asm-diskh aun=2 blkn=1|grep kfffde|head -20
kfffde[0].xptr.au:                    2 ; 0x4a0: 0x00000002
kfffde[0].xptr.disk:                  0 ; 0x4a4: 0x0000
kfffde[0].xptr.flags:                 0 ; 0x4a6: L=0 E=0 D=0 S=0
kfffde[0].xptr.chk:                  40 ; 0x4a7: 0x28
kfffde[1].xptr.au:                   20 ; 0x4a8: 0x00000014   # FILE DIR AU 1 AT DISK 1 AU 20
kfffde[1].xptr.disk:                  1 ; 0x4ac: 0x0001       # disk 1
kfffde[1].xptr.flags:                 0 ; 0x4ae: L=0 E=0 D=0 S=0
kfffde[1].xptr.chk:                  63 ; 0x4af: 0x3f
kfffde[2].xptr.au:           4294967295 ; 0x4b0: 0xffffffff   # 保留值
kfffde[2].xptr.disk:              65535 ; 0x4b4: 0xffff
kfffde[2].xptr.flags:                 0 ; 0x4b6: L=0 E=0 D=0 S=0

这个文件上只有1 个file directory, 0 file directory 是留给ASM METADATA。

# kfed read /dev/asm-diski aun=20 blkn=0|head -10
kfbh.endian:                          1 ; 0x000: 0x01
kfbh.hard:                          130 ; 0x001: 0x82
kfbh.type:                            4 ; 0x002: KFBTYP_FILEDIR
kfbh.datfmt:                          1 ; 0x003: 0x01
kfbh.block.blk:                     256 ; 0x004: blk=256  # asm file  256
kfbh.block.obj:                       1 ; 0x008: file=1
kfbh.check:                  3175892269 ; 0x00c: 0xbd4c452d
kfbh.fcn.base:                      540 ; 0x010: 0x0000021c
kfbh.fcn.wrap:                        0 ; 0x014: 0x00000000
kfbh.spare1:                          0 ; 0x018: 0x00000000

然后kfed merge修改AU 指针,启动ASM就可以。

Meaning of an asterisk at the end of a FileName item?文件名后带星号(*)

$
0
0

昨天看到oracle binary file 显示oracle执行文件名后带星号如oracle*,可能比较困惑,这样的文件名实例还是可用的, 实际这只是ls的显示问题,*并不是文件名的一部分。如下

[oracle@oel7db1 bin]$ ls
total 644084
drwxr-xr-x   2 oracle oinstall      8192 May 30  2020 ./
drwxrwxr-x. 70 oracle oinstall      4096 Apr  3  2020 ../
-rwxr-xr-x   1 oracle oinstall       727 Sep  8  2016 acfsremote*
-rwxr-xr-x   1 oracle oinstall       945 Jun 20  2016 acfsroot*
-rwxr-xr-x   1 oracle oinstall     13485 Mar 30  2019 adapters*
-rwxr-x--x   1 oracle oinstall     41840 Mar 20  2020 adrci*

[oracle@oel7db1 bin]$ file "oracle*"
oracle*: cannot open (No such file or directory)

实际上应该是
[oracle@oel7db1 bin]$ ls -l
total 644068
-rwxr-xr-x 1 oracle oinstall       727 Sep  8  2016 acfsremote
-rwxr-xr-x 1 oracle oinstall       945 Jun 20  2016 acfsroot
-rwxr-xr-x 1 oracle oinstall     13485 Mar 30  2019 adapters
-rwxr-x--x 1 oracle oinstall     41840 Mar 20  2020 adrci
...
-rwxr-x--- 1 oracle oinstall        46 Nov  7  2000 oracg
-rwsr-s--x 1 oracle oinstall 441253104 Mar 20  2020 oracle

给ls 加上"F"选项

[oracle@oel7db1 bin]$ alias ls="ls -laF"
[oracle@oel7db1 bin]$ ls
total 644084
drwxr-xr-x   2 oracle oinstall      8192 May 30  2020 ./
drwxrwxr-x. 70 oracle oinstall      4096 Apr  3  2020 ../
-rwxr-xr-x   1 oracle oinstall       727 Sep  8  2016 acfsremote*
-rwxr-xr-x   1 oracle oinstall       945 Jun 20  2016 acfsroot*
-rwxr-xr-x   1 oracle oinstall     13485 Mar 30  2019 adapters*
-rwxr-x--x   1 oracle oinstall     41840 Mar 20  2020 adrci*

[oracle@oel7db1 bin]$ which ls
alias ls='ls -laF'
        /bin/ls
[oracle@oel7db1 bin]$ alias ls
alias ls='ls -laF'
[oracle@oel7db1 bin]$

ls 
drwxr-xr-x   5 oracle oinstall    52 Apr 17  2019 R/
drwxr-xr-x   4 oracle oinstall    29 Apr 17  2019 racg/
drwxr-xr-x  13 oracle oinstall   140 Apr 18  2019 rdbms/
drwxr-xr-x   3 oracle oinstall    21 Apr 17  2019 relnotes/
-rwx------   1 oracle oinstall   610 Mar 20  2020 root.sh*
-rwx------   1 oracle oinstall   786 Apr 17  2019 root.sh.old*

Note:
ls -F选项在执行文件后面会以*星号结尾, 目录以/结尾等等。

info ls

`-F'
`--classify'
`--indicator-style=classify'
     Append a character to each file name indicating the file type.
     Also, for regular files that are executable, append `*'.  The file
     type indicators are `/' for directories, `@' for symbolic links,
     `|' for FIFOs, `=' for sockets, `>' for doors, and nothing for
     regular files.

Troubleshooting DB load high wait ‘ON CPU’ by New ASH in 12c R2

$
0
0

前在前面

2021年1月6日,石家庄被按下了暂停键,街道变得宁静,新冠肺炎疫情反扑,周围气氛变的紧张, “空城”、“管控”、“隔离”、“确诊”等词让人不安, 他日的新闻中的场景,今日我们正在经历, 我在国际庄,距离藁城最近,5号晚封城后开始多渠道筹备粮食,居家办公,等核算检测结果,每天刷看确诊人员活动轨迹是否有与自己重合,最近2天附近又有新增诊被接走,希望庄里的小伙伴做好防护,感谢医务人员和所有抗疫人员的付出,再坚持一下,寒冷的“冬天”总会过去,一起加油。

远程办公第二天就2起故障,有1个故障感觉比较有意思,特分享出来, 为了是表明猜测充分,原谅我这里附上较多的输出。

背景

6日下午17:20接到告警CPU使用率高, 环境 Oracle 12cR2  3-nodes RAC on Linux. 登录系统查看是实例1活动会话接近200. 这是一个<90 cpu的主机. Session status 全是on cpu.  当然从我们的监控上很直观定位2条select SQL 占用了50% 左右的db time.  首先可能怀疑是SQL 执行量增长或执行计划改变等效率变差了, 这是一个1类系统,需要快速恢复应用,客户要求先kill部分会话, 查看了sql执行计划并未改变, 可是在KILL 部分会话后还在负载逐渐增长,没有多长时间,17:29 主机ping不通了,并且没有重启。

应用还好有配置TAF自动failover到了其它节点,并且运行良好,就当时的负载能把主机压死确实不多见,难道X86就如此脆弱?  下一步如何分析? 我们的AWR 周期是30分钟,AWR中关于SQL stat的信息还没收集。 当然事后会说为什么不收systemdump , 为什么不收hanganalyze, 为什么不手动收AWR, 为什么不把v$ash 物化下来, 可往往故障就是这么猝不及防,如何根据当前的信息进行分析?

如果此时有套监控采集信息或许能够提供部分信息, 如分析sysstat中sql executes是不是增长了?奇怪这该时间段我们的监控sysstat数据也没有采集到.

当时KILL 部分会话后收集

sampling SID all with interval 5 seconds, taking 1 snapshots...
-- Session Snapper v4.14 BETA - by Tanel Poder ( http://blog.tanelpoder.com ) - Enjoy the Most Advanced Oracle Troubleshooting Script on the Planet! :)

----------------------------------------------------------------------------------------------------
Active% | INST | SQL_ID          | SQL_CHILD | EVENT                               | WAIT_CLASS
----------------------------------------------------------------------------------------------------
  3500% |    1 | 56twj7s93jaz4   | 0         | ON CPU                              | ON CPU
  1700% |    1 | dp8fnkzqdt3km   | 0         | ON CPU                              | ON CPU
  1300% |    1 | 05qszn0ufs4ff   | 0         | ON CPU                              | ON CPU
  1200% |    1 | 1b9zsamawq6mh   | 0         | ON CPU                              | ON CPU
  1100% |    1 | a7kcm21nbngvx   | 0         | ON CPU                              | ON CPU
  1100% |    1 | 2v7njuhdw0pgm   | 1         | ON CPU                              | ON CPU
  1000% |    1 | 13nf2mwh3xmsh   | 1         | ON CPU                              | ON CPU
   900% |    1 |                 | 0         | ON CPU                              | ON CPU
   700% |    1 | 60t0pum7f1pbm   | 1         | ON CPU                              | ON CPU
   600% |    1 | 60t0pum7f1pbm   | 2         | ON CPU                              | ON CPU

--  End of ASH snap 1, end=2021-01-06 17:24:43, seconds=9, samples_taken=1

可以确认当时全时ON CPU, 从上图看负载是从16:58左右开始, 分析这类问题DASH是常用的分析工具,之前总结过ASH相关的BLOG《Know more about Oracle ASH》,前不久还有同事问我ASH是何时从memory刷到disk中的, 1,默认AWR的快照间隔;2,如果ASH buffer 已满时MMNL进程都会负责这事。 如果17:00 到 17:30的AWR 没有形成,那17:00前那2分钟的DASH(dba_hist_active_sess_history)可以做为分析的入口。在统计top SQL 历史快照时发现实例1其实16:30 – 17:00 AWR snapshot也没形成。问题时间段跨越的2个AWR snapshot都没生成,那DASH 真没有数据了吗? 11G前是这样的,当12c不是的。

12c ASH 从memroy刷到disk形为改变

检查DASH数据是否存在?

SQL> select to_char(sample_time,'yyyymmdd hh24:mi'),count(*) --not * 10
from dba_hist_active_sess_history 
where sample_time >to_date('2021-01-06 17','yyyy-mm-dd hh24') and sample_time <to_date('2021-01-06 18','yyyy-mm-dd hh24') 
and instance_number=1 
group by to_char(sample_time,'yyyymmdd hh24:mi') order by 1;

TO_CHAR(SAMPLE   COUNT(*)
-------------- ----------
20210106 17:00        503
20210106 17:01        273
20210106 17:02        572
20210106 17:03        601
20210106 17:04        607
20210106 17:05        293
20210106 17:06        571
20210106 17:07        559
20210106 17:08        553
20210106 17:09        286
20210106 17:10        510
20210106 17:11        458
20210106 17:12        443
20210106 17:13        434
20210106 17:14        455
20210106 17:15        710
20210106 17:16        457
20210106 17:17        433
20210106 17:18        481
20210106 17:19        503
20210106 17:20        259
20210106 17:21        527
20210106 17:22        530
20210106 17:23        529
20210106 17:24        209

25 rows selected.

Note:
实例1 crash(17:28)之前的ASH数据基本上都在,这也正是oracle宣传的,ASH及时在系统负载很快时也可以很好的工作。 检查了db alert log没有提示ASH buffer 不足的问题, 那ASH是什么刷新频率刷到DISK上的呢?

SQL> select max(sample_time),sysdate from dba_hist_active_sess_history where instance_number=1;

MAX(SAMPLE_TIME)                                                            SYSDATE
--------------------------------------------------------------------------- -----------------
14-JAN-21 10.54.32.234 PM                                                   20210114 22:58:23

SQL> select max(sample_time),sysdate from dba_hist_active_sess_history where instance_number=1;

MAX(SAMPLE_TIME)                                                            SYSDATE
--------------------------------------------------------------------------- -----------------
14-JAN-21 10.54.32.234 PM                                                   20210114 22:59:52

SQL> r
  1* select max(sample_time),sysdate from dba_hist_active_sess_history where instance_number=1

MAX(SAMPLE_TIME)                                                            SYSDATE
--------------------------------------------------------------------------- -----------------
14-JAN-21 10.59.54.686 PM                                                   20210114 23:00:56

SQL> r
  1* select max(sample_time),sysdate from dba_hist_active_sess_history where instance_number=1

MAX(SAMPLE_TIME)                                                            SYSDATE
--------------------------------------------------------------------------- -----------------
14-JAN-21 11.04.26.622 PM                                                   20210114 23:07:58

Note:
非AWR snapshot flush时间,DASH也在逐渐的更新最新数据,基本上可以判断,当前的ASH是大概5分钟更新到DASH(dba_hist_active_sess_history)中, 那继续查找一下相关的ASH参数。

SQL> select
  2        n.indx
  3      , to_char(n.indx, 'XXXX') i_hex
  4      , n.ksppinm pd_name
  5      , c.ksppstvl pd_value
  6      , n.ksppdesc pd_descr
  7     from sys.x$ksppi n, sys.x$ksppcv c
  8     where n.indx=c.indx
  9     and  
 10        lower(n.ksppinm) || ' ' || lower(n.ksppdesc) like lower('%\_ash%')
 11  escape '\'   ;

      INDX I_HEX NAME                                 VALUE       DESCRIPTION
---------- ----- ------------------------------------ ----------- ----------------------------------------------------------------------
      4546  11C2 _ash_sampling_interval               1000        Time interval between two successive Active Session samples in
                                                                  millisecs

      4547  11C3 _ash_size                            1048618     To set the size of the in-memory Active Session History buffers
      4548  11C4 _ash_enable                          TRUE        To enable or disable Active Session sampling and flushing
      4549  11C5 _ash_disk_write_enable               TRUE        To enable or disable Active Session History flushing
      4550  11C6 _ash_disk_filter_ratio               10          Ratio of the number of in-memory samples to the number of samples
                                                                  actually written to disk

      4551  11C7 _ash_eflush_trigger                  66          The percentage above which if the in-memory ASH is full the emergency
                                                                  flusher will be triggered

      4552  11C8 _ash_sample_all                      FALSE       To enable or disable sampling every connected session including ones
                                                                  waiting for idle waits

      4553  11C9 _ash_dummy_test_param                0           Oracle internal dummy ASH parameter used ONLY for testing!
      4554  11CA _ash_min_mmnl_dump                   90          Minimum Time interval passed to consider MMNL Dump
      4555  11CB _ash_compression_enable              TRUE        To enable or disable string compression in ASH
      4556  11CC _ash_progressive_flush_interval      300         ASH Progressive Flush interval in secs

11 rows selected.

Note:
_ash_progressive_flush_interval 这个隐藏参数值300秒,描述也说明了它是控制ASH渐进式刷新频率秒数,该参数11G中并不存在,与之相关的TIPs几乎没有, 不过我们可以判断从12c除了上面提到的2种ASH flush形为,还有第3种,每300秒渐进式ASH也会flush到disk. 不得不感叹ORACLE一直在悄悄改善的更加完美, 这么实用的功能没有得到广泛的宣传。

从DASH 分析的SQL效率

先从现有的dba_hist_sqlstat分析TOP SQL的执行情况
脚本sql_hist.sql

                                  Summary Execution Statistics Over Time of SQL_ID:dp8fnkzqdt3km
                                                                                          Avg                 Avg
Snapshot                                              Avg LIO         Avg PIO      CPU (secs)      Elapsed (secs)
Beg Time     INSTANCE_NUMBER        Execs            Per Exec        Per Exec        Per Exec            Per Exec
------------ --------------- ------------ ------------------- --------------- --------------- -------------------
06-JAN 14:00               1          824          362,726.48            3.82            1.56                1.57
06-JAN 14:00               2          841                0.00            6.04            1.58                1.59
06-JAN 14:30               1        1,084          358,591.06            0.80            1.52                1.53
06-JAN 14:30               2          725          239,373.03           10.00            1.35                1.36
06-JAN 15:00               1        1,303          335,387.17            0.36            1.56                1.56
06-JAN 15:00               2          903          254,055.09            2.25            1.37                1.38
06-JAN 15:30               2          850          315,445.81           18.58            1.63                1.66
06-JAN 15:30               1        1,238          335,970.25            1.11            1.50                1.50
06-JAN 16:00               1        1,048          339,324.59            1.46            1.54                1.55
06-JAN 16:00               2          765          310,440.36            1.66            1.43                1.44
06-JAN 16:30               2          703          273,389.33           21.77            1.48                1.50
06-JAN 17:00               2          595          238,034.54           67.25            1.33                1.46
06-JAN 17:30               2          450          313,110.14          215.90            1.55                1.72
06-JAN 18:00               2          408          312,342.91           59.53            1.50                1.58
06-JAN 18:30               1           64          305,746.14        3,045.39            2.78                4.15
06-JAN 18:30               2          152          395,698.88          224.32            1.94                2.06
06-JAN 19:00               1           75          378,465.49          249.27            2.08                2.16
06-JAN 19:00               2          122          346,031.39           33.33            1.88                1.90
06-JAN 19:30               2           31          237,640.52           30.10            1.59                1.61
06-JAN 19:30               1           77          193,193.10           37.27            1.49                1.51
06-JAN 20:00               1           88          317,937.30          347.97            1.67                1.76
06-JAN 20:00               2           26          253,282.27            6.77            1.41                1.42
06-JAN 20:30               1           20          430,854.10            1.65            2.42                2.43
06-JAN 20:30               2           18          344,005.61           75.72            2.42                2.47
06-JAN 21:00               1            5          306,552.00           25.60            1.53                1.56
06-JAN 21:00               2           13          342,130.31            2.77            2.31                2.32
06-JAN 21:30               1           35            6,480.89            2.60            0.06                0.06
07-JAN 07:30               1           12          396,023.42        2,950.17            2.50                3.96
07-JAN 07:30               2           17        2,123,654.59        3,804.82            6.46                8.35
07-JAN 08:00               1          144          225,576.83          489.54            1.35                1.76

Note:
当然没有问题时间段的实例1 sql的执行情况,但是可以判断基本上每次执行20-40万的逻辑读,耗费时间为1-2秒,另外每天7:00和实例1刚启动时因为第一次物理读,单次执行也是在4-8秒之间。

看一下具体的负载趋势

SQL> create table dbmt.dash0106 tablespace users 
as select * from dba_hist_active_sess_history 
where sample_time >to_date('2021-01-06 16','yyyy-mm-dd hh24') and sample_time <to_date('2021-01-06 18','yyyy-mm-dd hh24') ; Table created. SQL>  select * from (
  2      select etime,nvl(event,'on cpu') events,sql_id, dbtime, cnt,first_time,end_time,
  3     round(100*ratio_to_report(dbtime) OVER (partition by etime ),2) pct,row_number() over(partition by etime order by dbtime  desc) rn
  4   from (
  5  select to_char(SAMPLE_TIME,'yyyymmdd hh24:mi') etime,event,sql_id,count(*)*10 dbtime,count(*) cnt,
  6  to_char(min(SAMPLE_TIME),'hh24:mi:ss') first_time,to_char(max(SAMPLE_TIME),'hh24:mi:ss') end_time
  7   from dbmt.dash0106
  8  --where sample_time between to_date('2015-4-1 16:00','yyyy-mm-dd hh24:mi') and to_date('2015-4-1 17:00','yyyy-mm-dd hh24:mi')
  9   where INSTANCE_NUMBER=1
 10   group by to_char(SAMPLE_TIME,'yyyymmdd hh24:mi'),event,sql_id
 11  )
 12  ) where rn<=5;

ETIME          EVENTS     SQL_ID            DBTIME        CNT FIRST_TI END_TIME        PCT         RN
-------------- ---------- ------------- ---------- ---------- -------- -------- ---------- ----------

20210106 16:30 on cpu     d506gkxjgw7xr         40          4 16:30:04 16:30:54       7.41          1
               on cpu     4vk65sy477mxm         40          4 16:30:24 16:30:54       7.41          2
               on cpu     1wcsvyq7xshqz         40          4 16:30:24 16:30:54       7.41          3
               on cpu                           40          4 16:30:04 16:30:44       7.41          4
               on cpu     60dw4cw904b83         30          3 16:30:14 16:30:34       5.56          5

20210106 16:31 on cpu     56twj7s93jaz4        120         12 16:31:24 16:31:24      15.19          1
               on cpu     b15j01vphnb60        100         10 16:31:14 16:31:34      12.66          2
               on cpu     dp8fnkzqdt3km        100         10 16:31:04 16:31:54      12.66          3
               db file se fmtaf5hf9tm7s         60          6 16:31:04 16:31:54       7.59          4
               quential r
               ead
               on cpu     gm9rz10b0kb50         60          6 16:31:14 16:31:44       7.59          5

20210106 16:32 on cpu     dp8fnkzqdt3km         50          5 16:32:15 16:32:45       9.43          1
               on cpu     4vk65sy477mxm         40          4 16:32:25 16:32:55       7.55          2
               on cpu     gvv9dcnsc1jf9         40          4 16:32:25 16:32:55       7.55          3
               on cpu     d506gkxjgw7xr         40          4 16:32:04 16:32:45       7.55          4
               on cpu     0hpuufdajtzch         30          3 16:32:04 16:32:25       5.66          5

20210106 16:33 on cpu     b15j01vphnb60         60          6 16:33:05 16:33:55      16.22          1
               on cpu     dp8fnkzqdt3km         40          4 16:33:15 16:33:45      10.81          2
               on cpu     4vk65sy477mxm         40          4 16:33:25 16:33:55      10.81          3
               db file se fmtaf5hf9tm7s         30          3 16:33:05 16:33:55       8.11          4
               quential r
               ead
               gc cr gran fmtaf5hf9tm7s         20          2 16:33:15 16:33:25       5.41          5
               t 2-way
...
...
...

20210106 16:54 on cpu     d506gkxjgw7xr         70          7 16:54:05 16:54:55      15.22          1
               on cpu                           40          4 16:54:25 16:54:45        8.7          2
               gc cr gran fmtaf5hf9tm7s         30          3 16:54:05 16:54:45       6.52          3
               t 2-way
               on cpu     1wcsvyq7xshqz         30          3 16:54:05 16:54:25       6.52          4
               on cpu     gvv9dcnsc1jf9         30          3 16:54:25 16:54:55       6.52          5

20210106 16:55 on cpu     d506gkxjgw7xr         70          7 16:55:05 16:55:45      12.07          1
               on cpu                           50          5 16:55:05 16:55:45       8.62          2
               db file se fmtaf5hf9tm7s         50          5 16:55:05 16:55:55       8.62          3
               quential r
               ead
               on cpu     gm9rz10b0kb50         40          4 16:55:05 16:55:55        6.9          4
               on cpu     gvv9dcnsc1jf9         40          4 16:55:05 16:55:55        6.9          5

20210106 16:56 on cpu     dp8fnkzqdt3km        100         10 16:56:05 16:56:56      17.24          1
               on cpu     c8t8f3rps66d5         50          5 16:56:05 16:56:46       8.62          2
               on cpu     gvv9dcnsc1jf9         40          4 16:56:16 16:56:46        6.9          3
               on cpu     d506gkxjgw7xr         40          4 16:56:05 16:56:56        6.9          4
               gc cr gran fmtaf5hf9tm7s         30          3 16:56:16 16:56:56       5.17          5
               t 2-way

20210106 16:57 on cpu     56twj7s93jaz4        920         92 16:57:23 16:57:44      27.71          1   
               on cpu     dp8fnkzqdt3km        350         35 16:57:08 16:57:44      10.54          2
               on cpu                          310         31 16:57:08 16:57:44       9.34          3
               on cpu     d506gkxjgw7xr        210         21 16:57:08 16:57:44       6.33          4
               on cpu     gvv9dcnsc1jf9        160         16 16:57:08 16:57:44       4.82          5

20210106 16:58 on cpu     56twj7s93jaz4       1970        197 16:58:08 16:58:57      36.41          1
               on cpu     dp8fnkzqdt3km       1100        110 16:58:08 16:58:57      20.33          2
               on cpu                          390         39 16:58:08 16:58:57       7.21          3
               on cpu     d506gkxjgw7xr        250         25 16:58:08 16:58:57       4.62          4
               on cpu     gvv9dcnsc1jf9        250         25 16:58:08 16:58:57       4.62          5

20210106 16:59 on cpu     56twj7s93jaz4       1370        137 16:59:25 16:59:53      32.39          1
               on cpu     dp8fnkzqdt3km       1220        122 16:59:25 16:59:53      28.84          2
               on cpu                          240         24 16:59:25 16:59:53       5.67          3
               on cpu     d506gkxjgw7xr        160         16 16:59:25 16:59:53       3.78          4
               on cpu     05qszn0ufs4ff        140         14 16:59:25 16:59:53       3.31          5

20210106 17:00 on cpu     dp8fnkzqdt3km       1650        165 17:00:25 17:00:56       32.8          1
               on cpu     56twj7s93jaz4       1360        136 17:00:25 17:00:56      27.04          2
               on cpu                          270         27 17:00:25 17:00:56       5.37          3
               on cpu     d500bxxqf6dbs        160         16 17:00:25 17:00:56       3.18          4
               on cpu     05qszn0ufs4ff        150         15 17:00:25 17:00:56       2.98          5

20210106 17:01 on cpu     dp8fnkzqdt3km        900         90 17:01:30 17:01:30      32.97          1
               on cpu     56twj7s93jaz4        620         62 17:01:30 17:01:30      22.71          2
               on cpu     60t0pum7f1pbm        160         16 17:01:30 17:01:30       5.86          3
               on cpu     2v7njuhdw0pgm        110         11 17:01:30 17:01:30       4.03          4
               on cpu                          100         10 17:01:30 17:01:30       3.66          5

20210106 17:02 on cpu     dp8fnkzqdt3km       1890        189 17:02:03 17:02:37      33.04          1
               on cpu     56twj7s93jaz4        970         97 17:02:03 17:02:37      16.96          2
               on cpu     60t0pum7f1pbm        510         51 17:02:03 17:02:37       8.92          3
               on cpu     2v7njuhdw0pgm        460         46 17:02:03 17:02:37       8.04          4
               on cpu     05qszn0ufs4ff        190         19 17:02:03 17:02:37       3.32          5

20210106 17:03 on cpu     dp8fnkzqdt3km       2090        209 17:03:12 17:03:47      34.78          1
               on cpu     56twj7s93jaz4        730         73 17:03:12 17:03:47      12.15          2
               on cpu     2v7njuhdw0pgm        660         66 17:03:12 17:03:47      10.98          3
               on cpu     60t0pum7f1pbm        470         47 17:03:12 17:03:47       7.82          4
               on cpu                          320         32 17:03:12 17:03:47       5.32          5

20210106 17:04 on cpu     dp8fnkzqdt3km       2100        210 17:04:19 17:04:58       34.6          1
               on cpu     2v7njuhdw0pgm        550         55 17:04:19 17:04:58       9.06          2
               on cpu     56twj7s93jaz4        550         55 17:04:19 17:04:58       9.06          3
               on cpu     60t0pum7f1pbm        360         36 17:04:19 17:04:58       5.93          4
               on cpu                          260         26 17:04:19 17:04:58       4.28          5

20210106 17:05 on cpu     dp8fnkzqdt3km        990         99 17:05:33 17:05:33      33.79          1
               on cpu     2v7njuhdw0pgm        240         24 17:05:33 17:05:33       8.19          2
               on cpu     56twj7s93jaz4        230         23 17:05:33 17:05:33       7.85          3
               on cpu     60t0pum7f1pbm        190         19 17:05:33 17:05:33       6.48          4
               on cpu     a7kcm21nbngvx        180         18 17:05:33 17:05:33       6.14          5

20210106 17:06 on cpu     dp8fnkzqdt3km       1980        198 17:06:05 17:06:40      34.68          1
               on cpu     2v7njuhdw0pgm        380         38 17:06:05 17:06:40       6.65          2
               on cpu     56twj7s93jaz4        380         38 17:06:05 17:06:40       6.65          3
               on cpu     a7kcm21nbngvx        380         38 17:06:05 17:06:40       6.65          4
               on cpu     60t0pum7f1pbm        320         32 17:06:05 17:06:40        5.6          5

20210106 17:07 on cpu     dp8fnkzqdt3km       1870        187 17:07:14 17:07:47      33.45          1
               on cpu     2v7njuhdw0pgm        400         40 17:07:14 17:07:47       7.16          2
               on cpu     a7kcm21nbngvx        320         32 17:07:14 17:07:47       5.72          3
               on cpu     f018b0x00auxp        310         31 17:07:14 17:07:47       5.55          4
               on cpu     60t0pum7f1pbm        300         30 17:07:14 17:07:47       5.37          5

20210106 17:08 on cpu     dp8fnkzqdt3km       1820        182 17:08:18 17:08:51      32.91          1
               on cpu     2v7njuhdw0pgm        420         42 17:08:18 17:08:51       7.59          2
               on cpu     f018b0x00auxp        400         40 17:08:18 17:08:51       7.23          3
               on cpu     13nf2mwh3xmsh        390         39 17:08:18 17:08:51       7.05          4
               on cpu     60t0pum7f1pbm        330         33 17:08:18 17:08:51       5.97          5

20210106 17:09 on cpu     dp8fnkzqdt3km        910         91 17:09:26 17:09:26      31.82          1
               on cpu     2v7njuhdw0pgm        310         31 17:09:26 17:09:26      10.84          2
               on cpu     f018b0x00auxp        220         22 17:09:26 17:09:26       7.69          3
               on cpu     60t0pum7f1pbm        180         18 17:09:26 17:09:26       6.29          4
               on cpu     13nf2mwh3xmsh        150         15 17:09:26 17:09:26       5.24          5

20210106 17:10 on cpu     dp8fnkzqdt3km       1830        183 17:10:02 17:10:35      35.88          1
               on cpu     2v7njuhdw0pgm        530         53 17:10:02 17:10:35      10.39          2
               on cpu     13nf2mwh3xmsh        290         29 17:10:02 17:10:35       5.69          3
               on cpu     f018b0x00auxp        280         28 17:10:02 17:10:35       5.49          4
               on cpu                          270         27 17:10:02 17:10:35       5.29          5

...

20210106 17:23 on cpu     dp8fnkzqdt3km       1390        139 17:23:09 17:23:40      26.28          1
               on cpu     56twj7s93jaz4        770         77 17:23:09 17:23:40      14.56          2
               on cpu     60t0pum7f1pbm        330         33 17:23:09 17:23:40       6.24          3
               on cpu     05qszn0ufs4ff        260         26 17:23:09 17:23:40       4.91          4
               on cpu                          250         25 17:23:09 17:23:40       4.73          5

20210106 17:24 on cpu     56twj7s93jaz4        390         39 17:24:07 17:24:07      18.66          1
               on cpu                          160         16 17:24:07 17:24:07       7.66          2
               on cpu     60t0pum7f1pbm        140         14 17:24:07 17:24:07        6.7          3
               on cpu     05qszn0ufs4ff        130         13 17:24:07 17:24:07       6.22          4
               on cpu     a7kcm21nbngvx        110         11 17:24:07 17:24:07       5.26          5


425 rows selected.

Note:
从16:57开始的, DBtime 呈上升趋势,并且wait event: ON CPU, 也能看到TOP  SQL。

正常时间段DASH中TOP sql

SQL> select session_id,to_char(sample_time,'yyyymmdd hh24:mi:ss') etime,event,sql_exec_id,SQL_EXEC_START,session_state,TIME_WAITED,IN_SQL_EXECUTION,TM_DELTA_CPU_TIME 
from dbmt.dash0106
 where sample_time >to_date('2021-01-06 16:45','yyyy-mm-dd hh24:mi') and sample_time <to_date('2021-01-06 16:54','yyyy-mm-dd hh24:mi') 
 and sql_id='dp8fnkzqdt3km' order by 1,2;

SESSION_ID ETIME             EVENT      SQL_EXEC_ID SQL_EXEC_START    SESSION TIME_WAITED I TM_DELTA_CPU_TIME
---------- ----------------- ---------- ----------- ----------------- ------- ----------- - -----------------
        12 20210106 16:49:22               20337054 20210106 16:49:20 ON CPU            0 Y           5824114
        12 20210106 16:49:53               20337078 20210106 16:49:51 ON CPU            0 Y           2731150
       467 20210106 16:45:06               41876133 20210106 16:45:05 ON CPU            0 Y          12821930
       921 20210106 16:52:14               20337167 20210106 16:52:13 ON CPU            0 Y           9083661
      1229 20210106 16:48:48               41876201 20210106 16:48:45 ON CPU            0 Y          28963774
      1532 20210106 16:45:10               20336897 20210106 16:45:06 ON CPU            0 Y          12105818
      1532 20210106 16:51:43               20337139 20210106 16:51:43 ON CPU            0 Y           9087716
      1535 20210106 16:47:52               20337014 20210106 16:47:51 ON CPU            0 Y           6957901
      1535 20210106 16:48:02               20337023 20210106 16:48:01 ON CPU            0 Y           6100204
      1537 20210106 16:47:11               20336989 20210106 16:47:11 ON CPU            0 Y          10426243
      1559 20210106 16:48:12               20337027 20210106 16:48:11 ON CPU            0 Y          20086346
      1559 20210106 16:48:22               20337032 20210106 16:48:17 ON CPU            0 Y           5404968
      1559 20210106 16:50:13               20337087 20210106 16:50:12 ON CPU            0 Y           5066286
      2292 20210106 16:49:02               20337039 20210106 16:49:00 ON CPU            0 Y           6094836
      2435 20210106 16:46:16               41876161 20210106 16:46:15 ON CPU            0 Y          16064789
      2741 20210106 16:49:02               20337040 20210106 16:49:01 ON CPU            0 Y           5135847
      2746 20210106 16:45:31               20336918 20210106 16:45:30 ON CPU            0 Y            559010
      2746 20210106 16:46:21               20336951 20210106 16:46:20 ON CPU            0 Y            442342

TIP:
主要是看同一session 同一SQL的执行情况,通过session_id(session_serial#)和sql_exec_id来确认,sql_exec_id在同一SESSION执行sql会累增,sql_exec_id不变再看SQL_EXEC_START SQL开始执行的时间。 可见正常时间SQL持续运行的时间都是<2秒的。

问题时间段的DASH中TOP sql

SQL> select session_id,--SESSION_SERIAL#, (used to uniquely identify a session's objects)
  to_char(sample_time,'yyyymmdd hh24:mi:ss') etime,event,sql_exec_id,SQL_EXEC_START,session_state,TIME_WAITED,IN_SQL_EXECUTION,TM_DELTA_CPU_TIME 
  from dbmt.dash0106 where sample_time >to_date('2021-01-06 16:58','yyyy-mm-dd hh24:mi') and sample_time <to_date('2021-01-06 17:10','yyyy-mm-dd hh24:mi') 
  and sql_id='dp8fnkzqdt3km' order by 1,2


SESSION_ID ETIME             EVENT      SQL_EXEC_ID SQL_EXEC_START    SESSION TIME_WAITED I TM_DELTA_CPU_TIME
---------- ----------------- ---------- ----------- ----------------- ------- ----------- - -----------------
         9 20210106 17:02:03               20337526 20210106 17:02:01 ON CPU            0 Y           3050637
         9 20210106 17:02:37               20337526 20210106 17:02:01 ON CPU            0 Y           8411155
         9 20210106 17:03:12               20337526 20210106 17:02:01 ON CPU            0 Y           7732513
         9 20210106 17:03:47               20337526 20210106 17:02:01 ON CPU            0 Y           8855886
         9 20210106 17:04:19               20337526 20210106 17:02:01 ON CPU            0 Y           6742950
         9 20210106 17:04:58               20337526 20210106 17:02:01 ON CPU            0 Y           8861440
         9 20210106 17:05:33               20337526 20210106 17:02:01 ON CPU            0 Y           7035218
         9 20210106 17:06:05               20337526 20210106 17:02:01 ON CPU            0 Y           7703591
         9 20210106 17:06:40               20337526 20210106 17:02:01 ON CPU            0 Y           8466669
        12 20210106 16:58:08               20337396 20210106 16:57:38 ON CPU            0 Y           7636384
        12 20210106 16:58:31               20337396 20210106 16:57:38 ON CPU            0 Y           6840769
        12 20210106 16:58:57               20337396 20210106 16:57:38 ON CPU            0 Y           6953856
        12 20210106 16:59:25               20337396 20210106 16:57:38 ON CPU            0 Y           6760293
        12 20210106 16:59:53               20337396 20210106 16:57:38 ON CPU            0 Y           6476894
        12 20210106 17:00:25               20337396 20210106 16:57:38 ON CPU            0 Y           6974848
        12 20210106 17:00:56               20337396 20210106 16:57:38 ON CPU            0 Y           5540165
        12 20210106 17:01:30               20337396 20210106 16:57:38 ON CPU            0 Y           6374697
        12 20210106 17:02:03               20337396 20210106 16:57:38 ON CPU            0 Y           6177705
        12 20210106 17:02:37               20337396 20210106 16:57:38 ON CPU            0 Y           5990692
        12 20210106 17:03:12               20337396 20210106 16:57:38 ON CPU            0 Y           6111413
        12 20210106 17:03:47               20337396 20210106 16:57:38 ON CPU            0 Y           6873905
        12 20210106 17:04:19               20337396 20210106 16:57:38 ON CPU            0 Y           5680029
        12 20210106 17:04:58               20337396 20210106 16:57:38 ON CPU            0 Y           6661646
        12 20210106 17:05:33               20337396 20210106 16:57:38 ON CPU            0 Y           5920078
        12 20210106 17:06:05               20337396 20210106 16:57:38 ON CPU            0 Y           6712145
        12 20210106 17:06:40               20337396 20210106 16:57:38 ON CPU            0 Y           6765375
        12 20210106 17:07:14               20337396 20210106 16:57:38 ON CPU            0 Y           5585508
        12 20210106 17:07:47               20337396 20210106 16:57:38 ON CPU            0 Y           6002971
        12 20210106 17:08:18               20337396 20210106 16:57:38 ON CPU            0 Y           6159024
        12 20210106 17:08:51               20337396 20210106 16:57:38 ON CPU            0 Y           6594718
        12 20210106 17:09:26               20337396 20210106 16:57:38 ON CPU            0 Y           6444770
        40 20210106 17:03:47               20337544 20210106 17:03:13 ON CPU            0 Y           8750964
        40 20210106 17:04:19               20337544 20210106 17:03:13 ON CPU            0 Y           5033203
        40 20210106 17:04:58               20337544 20210106 17:03:13 ON CPU            0 Y           6892512
        40 20210106 17:05:33               20337544 20210106 17:03:13 ON CPU            0 Y           6081303
        40 20210106 17:06:05               20337544 20210106 17:03:13 ON CPU            0 Y           6165369
        40 20210106 17:06:40               20337544 20210106 17:03:13 ON CPU            0 Y           6525653
        40 20210106 17:07:14               20337544 20210106 17:03:13 ON CPU            0 Y           5790222
        40 20210106 17:07:47               20337544 20210106 17:03:13 ON CPU            0 Y           6261831
        40 20210106 17:08:18               20337544 20210106 17:03:13 ON CPU            0 Y           5841272
        40 20210106 17:08:51               20337544 20210106 17:03:13 ON CPU            0 Y           6215711
        40 20210106 17:09:26               20337544 20210106 17:03:13 ON CPU            0 Y           6987163
        44 20210106 17:00:56               20337496 20210106 17:00:34 ON CPU            0 Y           7026321
        44 20210106 17:01:30               20337496 20210106 17:00:34 ON CPU            0 Y           8437444
        44 20210106 17:02:03               20337496 20210106 17:00:34 ON CPU            0 Y           8608695
        44 20210106 17:02:37               20337496 20210106 17:00:34 ON CPU            0 Y           8561660
        44 20210106 17:03:12               20337496 20210106 17:00:34 ON CPU            0 Y           8350169
       181 20210106 16:58:08               20337392 20210106 16:57:35 ON CPU            0 Y          10671584
...

Note:
这个时段的sql个别会话单次执行时间4分钟,10分钟以上。且这时间段没有I/O 类(物理读)wait event 全是ON CPU,业务也确认该时间没有太多数据变化, 从业务failover到其它节点后的执行效率也基本上是2秒内和之前一样,也能判断不是数据变化问题。

当然2个时间段的SQL 执行计划也一致

SQL> select to_char(sample_time,'yyyymmdd hh24:mi') etime,sql_id,SQL_PLAN_HASH_VALUE,count(*) from dbmt.dash0106 where sample_time >to_date('2021-01-06 16:40','yyyy-mm-dd hh24:mi') and sample_time <to_date('2021-01-06 17:10','yyyy-mm-dd hh24:mi') and sql_id in('dp8fnkzqdt3km','56twj7s93jaz4') group by to_char(sample_time,'yyyymmdd hh24:mi'),sql_id,SQL_PLAN_HASH_VALUE order by 2,1;

ETIME          SQL_ID        SQL_PLAN_HASH_VALUE   COUNT(*)
-------------- ------------- ------------------- ----------
20210106 16:40 dp8fnkzqdt3km          2900077901         11
20210106 16:41 dp8fnkzqdt3km          2900077901          4
20210106 16:42 dp8fnkzqdt3km          2900077901          7
20210106 16:43 dp8fnkzqdt3km          2900077901          9
...
20210106 16:51 dp8fnkzqdt3km          2900077901          3
20210106 16:52 dp8fnkzqdt3km          2900077901          6
20210106 16:53 dp8fnkzqdt3km          2900077901          9
20210106 16:54 dp8fnkzqdt3km          2900077901          6
20210106 16:55 dp8fnkzqdt3km          2900077901          6
20210106 16:56 dp8fnkzqdt3km          2900077901         11
20210106 16:57 dp8fnkzqdt3km          2900077901         47
20210106 16:58 dp8fnkzqdt3km          2900077901        111
20210106 16:59 dp8fnkzqdt3km          2900077901        123
20210106 17:00 dp8fnkzqdt3km          2900077901        168
20210106 17:01 dp8fnkzqdt3km          2900077901         95
20210106 17:02 dp8fnkzqdt3km          2900077901        193
20210106 17:03 dp8fnkzqdt3km          2900077901        213
...
20210106 17:08 dp8fnkzqdt3km          2900077901        186
20210106 17:09 dp8fnkzqdt3km          2900077901         95

其它SQL也存在这种现象。执行计划一致,数据无变化,短时间内单次执行时间从秒级放大分钟级,并且session state 也是在ON CPU, 这段时间在buffer gets做运算,所以怀疑当时buffer gets出现系统调用问题。

主机什么原因CRASH

主机上的messages log服务问题没有生成日志,但是硬件工程师确认是因为物理内存损坏了,时间点也基本和数据库负载突增吻合, 所以有理由怀疑是在主机CRASH前,内存异常,导致数据库同一类SQL的内存内数据buffer get异常,单次SQL执行时间变长,最终导致负载的积压。

本次数据库负载异常或故障突然CRASH,而AWR snapshot没有形成时,在12c后中的ASH每5分钟逐渐式flush disk,已不会刷新太频繁而增加系统负载,也不会等到AWR SNAPSHOT时间大粒度间隔而突然重启而ASH数据缺失无法分析。本次就是利用DASH中SQL两个时间段的SQL执行持续时间判断SQL变慢而导致的业务积压,而非SQL执行量增加,或执行计划变化。

— ENJOY —

Troubleshooting errors caused by OS resource limit on AIX,HP-UX, SolarisOS, Linux

$
0
0

操作系统资源限制有时会导致上面的应用程序无法fock新进程或open 文件,导致连接创建失败或实例crash, 尤其当数据库的进程数搞的很大时,开始的OS kernel resource limit没有级联的修改,就有可能导致该问题的发生。

CASE 1, HP-UX 11.31 通过监听创建新连接报错

TNS-12518: TNS:listener could not hand off client connection
TNS-12536: TNS:operation would block
TNS-12560: TNS:protocol adapter error
TNS-00506: Operation would block
HPUX Error: 246: Operation would block

以上可看是遇到OS 进程上限,需要检查uproc和maxuproc, ORACLE环境建议值

参数名 NODE1 Oracle推荐值
aio_max_ops 8192 >= 2048
executable_stack 0 0
filecache_min 3% 5%
filecache_max 5% 10%
ksi_alloc_max 131072 >= nproc*8
max_async_ports 16384 >= nproc
max_thread_proc 1200 >= 1024
maxdsiz 1073741824 >= 1073741824
maxdsiz_64bit 137438953472 >= 2147483648
maxssiz 134217728 >= 134217728
maxssiz_64bit 2147483648 >= 1073741824
maxuprc 20000 >= ((nproc*9)/10)+1
msgmni 16384 >= nproc
msgtql 16384 >= nproc
ncsize 134144 8*nproc+3072
nflocks 16384 >= nproc

查看资源使用

oracle@anbob:/home/oracle> kcusage                                                                                                                                                                                     
Tunable                 Usage / Setting      
=============================================
filecache_max     33312395264 / 39194697728
maxdsiz             352256000 / 1073741824
maxdsiz_64bit       239075328 / 137438953472
maxfiles_lim            23564 / 65535
maxssiz                131072 / 134217728
maxssiz_64bit         2097152 / 2147483648
maxtsiz              13484032 / 100663296
maxtsiz_64bit       771751936 / 1073741824
maxuprc                 15551 / 16384
max_thread_proc           385 / 1200
msgmbs                      0 / 8
msgmni                      2 / 16384
msgtql                      0 / 16384
nflocks                   101 / 16384
ninode                  10403 / 1157120
nkthread                18576 / 28688
nproc                   16382 / 21000
npty                        2 / 60
nstrpty                    12 / 60
nstrtel                     0 / 60
nswapdev                    2 / 32
nswapfs                     0 / 32
semmni                    116 / 1024
semmns                  22095 / 307200
shmmax           161061273600 / 274877906944
shmmni                     39 / 4096
shmseg                      4 / 512

CASE2, AIX 平台的应用运行时报错

ORA-04030:  (TCHK^9d12ad4,eavp:kkestRCHistgrm)

call stack 中包含“kghnospc“=》 kernel generic heap manager no space available in the heap, signal an error
dump trace

=======================================
PRIVATE MEMORY SUMMARY FOR THIS PROCESS
---------------------------------------
******************************************************
PRIVATE HEAP SUMMARY DUMP
111 MB total:   #进程使用PGA 111MB
   111 MB commented, 605 KB permanent
    47 KB free (0 KB in empty extents),
     103 MB,   1 heap:    "session heap   "
------------------------------------------------------
Summary of subheaps at depth 1
110 MB total:
    35 MB commented, 109 KB permanent
    75 MB free (30 MB in empty extents),
      45 MB,   1 heap:    "kolr heap ds i "            44 MB free held
      28 MB,   3 heaps:   "koh dur heap d "            1056 KB free held

-------------------------
Top 10 processes:
-------------------------
(percentage is of 1697 MB total allocated memory)
 7% pid 201: 111 MB used of 112 MB allocated  # CURRENT PROC 当前进程使用最高,111MB
 4% pid 204: 56 MB used of 63 MB allocated (5696 KB freeable)
 4% pid 13: 60 MB used of 62 MB allocated
 4% pid 14: 59 MB used of 62 MB allocated
 3% pid 202: 53 MB used of 59 MB allocated (6016 KB freeable)
 3% pid 200: 52 MB used of 58 MB allocated (5824 KB freeable)
 3% pid 40: 52 MB used of 56 MB allocated (832 KB freeable)
 3% pid 37: 41 MB used of 55 MB allocated
 3% pid 12: 50 MB used of 52 MB allocated
 3% pid 173: 42 MB used of 49 MB allocated (5888 KB freeable)

================
SWAP INFORMATION
----------------
swap info: free_mem = 22096.49M rsv = 192.00M
           alloc = 112.52M avail = 49152.00M swap_free = 49039.48M
----- End of Customized Incident Dump(s) -----

ITpub案例类似, 需要检查PGA, _pga_max_size 和_smm_max_size和OS $ ulimit -a限制和当前进程的Limit限制

AIX 可以使用dbx查看当前进程的limit, 可以选LOCAL=NO server进程或LISTENR进程

# dbx -a [pid]
Type 'help' for help.
reading symbolic information ...
stopped in read at 0x90000000003c260 ($t1)
0x90000000003c260 (read+0x260) e8410028             ld   r2,0x28(r1)
(dbx) proc rlimit
rlimit name:          rlimit_cur               rlimit_max       (units)
 RLIMIT_CPU:         (unlimited)             (unlimited)        sec
 RLIMIT_FSIZE:       (unlimited)             (unlimited)        bytes
 RLIMIT_DATA:          134217728             (unlimited)        bytes  
 RLIMIT_STACK:          33554432              4294967296        bytes
 RLIMIT_CORE:        (unlimited)             (unlimited)        bytes
 RLIMIT_RSS:            33554432             (unlimited)        bytes
 RLIMIT_AS:          (unlimited)             (unlimited)        bytes
 RLIMIT_NOFILE:           100000             (unlimited)        descriptors
 RLIMIT_THREADS:     (unlimited)             (unlimited)        per process
 RLIMIT_NPROC:       (unlimited)             (unlimited)        per user
(dbx) 

Note:
in the dbx rlimit output, the RLIMIT_CUR is the soft limit and the RLIMIT_MAX is the hard limit. RLIMIT_CUR is the limit that is actually enforced, so the problem may persist if RLIMIT_CUR is not unlimited, even though RLIMIT_MAX may be unlimited. In this case, the instance may need to be restarted in order for RLIMIT_CUR to take on the new value.

如果不通过监听的进程则不存在该限制(继承oracle user limit), 原因是因为通过监听创建的进程依赖监听的limit配置,监听又依赖于启动监听的用户limit, 如是LISTNEER是OHASD CRS启动那继承的root, 如果是grid手工启需要检查grid limit, 当然也存在在调整了OS limit后,进程没有重启识别不到已改变的limit.

case 3, Solaris SunOS swap 不足出现的ora-4030

查看进程的Limit可以使用plimit

# plimit [PID]

按swap排序 
$ awk '/^zzz/{t=$5;next}/^\s*[0-9]/{print t,$4,$5}' xxxxxx_vmstat_16.10.31.1500.dat | sort -k2,2rn


How to Configure Swap Space (Doc ID 286388.1) 建议swap space=75%* OS memory
How does the Solaris Operating System Calculate Available Swap? (Doc ID 1010585.1)

When a process calls the malloc()/sbrk() commands, only virtual swap is allocated.
The operating system allocates the memory from physical disk-based swap first.
If disk-based swap is exhausted or unconfigured, the reservation is allocated from physical memory.
If both resources are exhausted then the malloc() call fails.
To ensure malloc() won't fail due to lack of virtual swap, configure a large physical disk-based swap
facility in the form of a device or swapfile.  You can monitor swap reservation via "swap -s" and "vmstat:swap",
as described above.

Follow the guidelines below to calculate amount of virtual swap usage:
Virtual swap = Physical Memory + Fixed Disk swap

CASE 4, linux 平台,在安装如OEM agent平台,进程不足
在linux 平台查看当前进程limit的方法比较多,如查看proc系统中进程限制

$ cat /proc/PID/limits

Nproc在操作系统级别定义,以限制每个用户的进程数。Oracle 11.2.0.4文档建议以下内容:

oracle soft nproc 2047
oracle hard nproc 16384

如果有运行oem agent这可能有点低, 您是否要检查自己是否超出限制?那么您可以使用“ ps”。但是请注意,默认情况下,“ ps”不会显示所有进程。在Linux中,执行多线程处理时,每个线程都实现为轻量级进程(LWP)。并且您必须使用“ -L”来查看所有这些内容。如以用户分组

$ ps h -Led -o user | sort | uniq -c | sort -n

如果不使用”-L” 还可以使用”ps -o nlwp,pid,lwp,args -u oracle | sort -n” 如有些环境Oracle 12c EM agent已启动可以启动1000多个个线程,当您达到nproc限制时,用户将无法创建新进程。clone()调用将返回EAGAIN,Oracle将其报告为:
ORA-27300: OS system dependent operation:fork failed with status: 11
ORA-27301: OS failure message: Resource temporarily unavailable

下面模拟一段Franck有段简短的forc进程的代码略改动一下,测试

[root@anbob ~]# ps h -Led -o user | sort | uniq -c | sort -n
      1 chrony
      1 dbus
      1 oracle
      1 rpc
      7 polkitd
    133 root
[oracle@oel7db1 ~]$ ulimit -u 500
[oracle@oel7db1 ~]$ cat fockp.c
#include
#include <sys/resource.h>
#include 
int main( int argc, char *argv[] )
{
        int i;
        int p[3000];
        // get nproc limit
        struct rlimit rl;
        if ( getrlimit( RLIMIT_NPROC , &rl) != 0 ) {
            printf("getrlimit() failed with errno=%d\n", errno);
                return 255;
        };
        // fork 3000 times
        for( i=1 ; i<= 3000 ; i++ ) { p[i] = fork(); if ( p[i] >= 0 ) {
                        if (  p[i] == 0 ) {
                                printf("parent says fork number %d sucessful \n" , i );
                        } else {
                                printf(" child says fork number %d pid %d \n" , i , p[i] );
                                sleep(100);
                                break;
                        }
                } else {
                        printf("parent says fork number %d failed (nproc: soft=%d hard=%d) with errno=%d\n", i, rl.rlim_cur , rl.rlim_max , errno);
                        return 255;
                }
        }
}

编译执行
[oracle@anbob ~]$ ./fockp
 child says fork number 1 pid 2442
parent says fork number 1 sucessful
 child says fork number 2 pid 2443
parent says fork number 2 sucessful
 child says fork number 3 pid 2444
parent says fork number 3 sucessful
 child says fork number 4 pid 2445
parent says fork number 4 sucessful
...
parent says fork number 497 sucessful
 child says fork number 498 pid 2941
parent says fork number 498 sucessful
parent says fork number 499 failed (nproc: soft=500 hard=500) with errno=11

使用root查看
[root@anbob ~]# ps h -Led -o user | sort | uniq -c | sort -n
      1 chrony
      1 dbus
      1 rpc
      7 polkitd
    133 root
    500 oracle

Linux平台限制在早期/etc/limits.conf中设置并用’ulimit -u’检查,但是根据RHEL官方文档,在5-8修改参数是修改/etc/security/limits.conf。

How to set ulimit values
Environment
Red Hat Enterprise Linux (RHEL) 5, 6, 7, 8
Issue
How to set ulimit values
Resolution
Settings in /etc/security/limits.conf take the following form:
# vi /etc/security/limits.conf
#            

*               -       core             
*               -       data             
*               -       priority         
*               -       fsize            
*               soft    sigpending        eg:57344
*               hard    sigpending        eg:57444
*               -       memlock          
*               -       nofile            eg:1024
*               -       msgqueue          eg:819200
*               -       locks            
*               soft    core             
*               hard    nofile           
@        hard    nproc            
          soft    nproc            
%        hard    nproc            
          hard    nproc            
@        -       maxlogins        
          hard    cpu              
          soft    cpu              
          hard    locks            
 can be:

a user name
a group name, with @group syntax
the wildcard *, for default entry
the wildcard %, can be also used with %group syntax, for maxlogin limit
 can have two values:

soft for enforcing the soft limits
hard for enforcing hard limits
 can be one of the following:

core - limits the core file size (KB)
data - max data size (KB)
fsize - maximum filesize (KB)
memlock - max locked-in-memory address space (KB)
nofile - max number of open files
rss - max resident set size (KB)
stack - max stack size (KB)
cpu - max CPU time (MIN)
nproc - max number of processes (see note below)
as - address space limit (KB)
maxlogins - max number of logins for this user
maxsyslogins - max number of logins on the system
priority - the priority to run user process with
locks - max number of file locks the user can hold
sigpending - max number of pending signals
msgqueue - max memory used by POSIX message queues (bytes)
nice - max nice priority allowed to raise to values: [-20, 19]
rtprio - max realtime priority
Exit and re-login from the terminal for the change to take effect.

文档中Setting nproc in /etc/security/limits.conf has no effect in Red Hat Enterprise Linux. 配置nproc不启作用,
Resolution
Add the desired entry in /etc/security/limits.d/90-nproc.conf instead of /etc/security/limits.conf.
Root Cause
For limits, the PAM stack is moving to a modular configuration. This includes the introduction of /etc/security/limits.d/90-nproc.conf, which sets the maximum number of processes to 1024 for non-root users. This was done in part to prevent fork-bombs.

After reading /etc/security/limits.conf, individual files from the /etc/security/limits.d/ directory are read. Only files with *.conf extension will be read from this directory.

所以如果安装oracle preinstall PRM配置oracle环境会发现它也是在/etc/security/limits.d/oracle-rdbms-server-12cR1-preinstall.conf中,它会覆盖/etc/security/limits.conf。

Linux的优点之一是您可以控制几乎所有与其相关的内容。这使系统管理员可以很好地控制其系统并更好地利用系统资源。还可以修复一个已经运行中的程序的limit限制,这适用于如应用server无重启时间,可以在线修改。On Linux systems with kernel >=2.6.36 and util-linux >=2.21, you can use the prlimit command to set a process resource limits: (和solariOS有点像)

下面演示如何修改一个已运行的程序的limit

[root@anbob ~]# ps -ef|grep lsnr
oracle   15837     1  0 00:02 ?        00:00:00 /u01/app/oracle/product/19.2.0/db_1/bin/tnslsnr LISTENER -inherit
root     16128 16100  0 00:07 pts/1    00:00:00 grep --color=auto lsnr

[root@anbob ~]# cat /proc/15837/limits
Limit                     Soft Limit           Hard Limit           Units
Max cpu time              unlimited            unlimited            seconds
Max file size             unlimited            unlimited            bytes
Max data size             unlimited            unlimited            bytes
Max stack size            10485760             33554432             bytes
Max core file size        0                    unlimited            bytes
Max resident set          unlimited            unlimited            bytes
Max processes             16384                16384                processes
Max open files            65536                65536                files
Max locked memory         137438953472         137438953472         bytes
Max address space         unlimited            unlimited            bytes
Max file locks            unlimited            unlimited            locks
Max pending signals       14595                14595                signals
Max msgqueue size         819200               819200               bytes
Max nice priority         0                    0
Max realtime priority     0                    0
Max realtime timeout      unlimited            unlimited            us

[oracle@anbob ~]$ gdb
GNU gdb (GDB) Red Hat Enterprise Linux 7.6.1-115.el7
Copyright (C) 2013 Free Software Foundation, Inc.
License GPLv3+: GNU GPL version 3 or later <http://gnu.org/licenses/gpl.html>
This is free software: you are free to change and redistribute it.
There is NO WARRANTY, to the extent permitted by law.  Type "show copying"
and "show warranty" for details.
This GDB was configured as "x86_64-redhat-linux-gnu".
For bug reporting instructions, please see:
<http://www.gnu.org/software/gdb/bugs/>.

(gdb) attach 15837
Attaching to process 15837

(gdb) set $rlim = &{0ll, 0ll}
(gdb) print getrlimit(7, $rlim)
$1 = 0
(gdb) print *$rlim
$2 = {65536, 65536}

TIP:
        Limit                 
     0  Max cpu time          
     1  Max file size         
     2  Max data size         
     3  Max stack size        
     4  Max core file size    
     5  Max resident set      
     6  Max processes         
     7  Max open files        
     8  Max locked memory     
     9  Max address space     
    10  Max file locks        
    11  Max pending signals   
    12  Max msgqueue size     
    13  Max nice priority     
    14  Max realtime priority 
    15  Max realtime timeout  

# 使用gdb modify 
(gdb) set *$rlim[0] = 1024*4
(gdb) print *$rlim
$3 = {4096, 65536}
(gdb) print setrlimit(7, $rlim)
$4 = 0

[root@anbob ~]# cat /proc/15837/limits|grep "open files"
Limit                     Soft Limit           Hard Limit           Units
Max open files            4096                 65536                files

[root@anbob ~]# prlimit  --nofile --output RESOURCE,SOFT,HARD --pid 15837
RESOURCE SOFT  HARD
NOFILE   4096 65536


# 使用prlimit修改
[root@anbob ~]# prlimit --nofile=1024:8192 --pid 15837

[root@anbob ~]# cat /proc/15837/limits |grep "open files"
Limit                     Soft Limit           Hard Limit           Units
Max open files            1024                 8192                 files

(gdb) print getrlimit(7, $rlim)
$5 = 0
(gdb) print *$rlim
$6 = {1024, 8192}
(gdb)

Note:
resource limit限制分为soft和hard, soft limit就是实际resource限制,hard limit限制只是为了使用limit命令可以修改的最大上限。

Oracle 12C新特性: Attribute Clustering

$
0
0

提起index的cluster factor集群因子可能都并不陌生,反映了表上数据索引列顺序分散的程度,Attribute Clustering这是Oracle数据库版本12.1.0.2中的一项新功能,该功能允许dba在将表记录在insert写到磁盘时能否保持顺序,保持较好的cluster factor,从而使磁盘上的近按照批定列的顺序在物理记录保持紧密在一起。通过将具有相似值的记录聚类在一起,匹配特定sql过滤条件的数据将存储在磁盘上的同一块或相邻块上的可能性就更高。通过这种数据放置,与以插入顺序存储数据相比,可以用更少的磁盘IO操作检索请求的数据,所以调整物理顺序以匹配它们是有利的。但是它有一些限制,这里做几个小测试。

Attribute clustering在传统的DML中并不适用,仅在以下场景中实用:

1, CTAS
2, Bulk loads using direct path insert like : insert /*+ append */ select … from table
3, Data movement operations like:
      Alter table xx move [online]
      move Online table redefinition

下面测试

[oracle@oel7db1 ~]$ sqlplus anbob/anbob@cdb1pdb1

SQL*Plus: Release 19.0.0.0.0 - Production on Fri Jan 22 00:42:30 2021
Version 19.3.0.0.0

Copyright (c) 1982, 2019, Oracle.  All rights reserved.

Last Successful login time: Fri Jan 22 2021 00:40:09 -05:00

Connected to:
Oracle Database 19c Enterprise Edition Release 19.0.0.0.0 - Production
Version 19.3.0.0.0


USERNAME             INST_NAME            HOST_NAME                  I# SID   SERIAL#  VERSION    STARTED  SPID       OPID  CPID            SADDR            PADDR
-------------------- -------------------- ------------------------- --- ----- -------- ---------- -------- ---------- ----- --------------- ---------------- ----------------
ANBOB                PDB1-anbob19c        oel7db1                     1 75    55372    19.0.0.0.0 20210122 2527       56    2525            0000000078139938 0000000078D16AE8


SQL> create table t_ci(id number,name varchar2(30));
Table created.

SQL> insert into t_ci select trunc(dbms_random.value(1,9000000)),'anbob'||rownum from xmltable('1 to 100000');
100000 rows created.

SQL> commit;
Commit complete.

SQL> create index idx_t_ci_id on t_ci(id);
Index created.

SQL> @ind idx_t_ci
Display indexes where table or index name matches %idx_t_ci%...

TABLE_OWNER          TABLE_NAME   INDEX_NAME    POS# COLUMN_NAME                    DSC
-------------------- ------------ ------------- ---- ------------------------------ ----
ANBOB                T_CI         IDX_T_CI_ID      1 ID

INDEX_OWNER          TABLE_NAME   INDEX_NAME    IDXTYPE    UNIQ STATUS   PART TEMP  H     LFBLKS           NDK   NUM_ROWS       CLUF LAST_ANALYZED       DEGREE VISIBILIT
-------------------- ------------ ------------- ---------- ---- -------- ---- ---- -- ---------- ------------- ---------- ---------- ------------------- ------ ---------
ANBOB                T_CI         IDX_T_CI_ID   NORMAL     NO   VALID    NO   N     2        236         99472     100000      99650 2021-01-22 00:50:18 1      VISIBLE

Note:
传统insert 后index 的cluster factor 99650

SQL> create table t_ci_enable(id number,name varchar2(30))
CLUSTERING
BY LINEAR ORDER (ID)
YES ON LOAD  YES ON DATA MOVEMENT;

SQL> insert into t_ci_enable select * from t_ci;
100000 rows created.

SQL> commit;
Commit complete.

SQL>   create index idx_t_ci_enable_id on t_ci_enable(id);
Index created.

SQL> @ind idx_t_ci
Display indexes where table or index name matches %idx_t_ci%...

TABLE_OWNER          TABLE_NAME                     INDEX_NAME                     POS# COLUMN_NAME                    DSC
-------------------- ------------------------------ ------------------------------ ---- ------------------------------ ----
ANBOB                T_CI                           IDX_T_CI_ID                       1 ID
                     T_CI_ENABLE                    IDX_T_CI_ENABLE_ID                1 ID


INDEX_OWNER          TABLE_NAME                     INDEX_NAME                     IDXTYPE    UNIQ STATUS   PART TEMP  H     LFBLKS           NDK   NUM_ROWS       CLUF LAST_ANALYZED       DEGREE VISIBILIT
-------------------- ------------------------------ ------------------------------ ---------- ---- -------- ---- ---- -- ---------- ------------- ---------- ---------- ------------------- ------ ---------
ANBOB                T_CI                           IDX_T_CI_ID                    NORMAL     NO   VALID    NO   N     2        236         98888     100000      99650 2021-01-22 01:00:30 1      VISIBLE
                     T_CI_ENABLE                    IDX_T_CI_ENABLE_ID             NORMAL     NO   VALID    NO   N     2        236         99472     100000      99648 2021-01-22 01:08:45 1      VISIBLE

Note:
表级启用了CLUSTERING BY LINEAR ORDER, 传统insert和之前默认的cluster factor一个量级为 99648

SQL>  create table t_ci_enable1(id number,name varchar2(30))
CLUSTERING
 BY LINEAR ORDER (ID)
YES ON LOAD  YES ON DATA MOVEMENT;

Table created.

SQL>  insert /*+append*/ into t_ci_enable1 select * from t_ci;

100000 rows created.

SQL>  create index idx_t_ci_enable1_id on t_ci_enable1(id);

Index created.

SQL> @ind idx_t_ci
Display indexes where table or index name matches %idx_t_ci%...

TABLE_OWNER          TABLE_NAME                     INDEX_NAME                     POS# COLUMN_NAME                    DSC
-------------------- ------------------------------ ------------------------------ ---- ------------------------------ ----
ANBOB                T_CI                           IDX_T_CI_ID                       1 ID
                     T_CI_ENABLE                    IDX_T_CI_ENABLE_ID                1 ID
                     T_CI_ENABLE1                   IDX_T_CI_ENABLE1_ID               1 ID


INDEX_OWNER          TABLE_NAME                     INDEX_NAME                     IDXTYPE    UNIQ STATUS   PART TEMP  H     LFBLKS           NDK   NUM_ROWS       CLUF LAST_ANALYZED       DEGREE VISIBILIT
-------------------- ------------------------------ ------------------------------ ---------- ---- -------- ---- ---- -- ---------- ------------- ---------- ---------- ------------------- ------ ---------
ANBOB                T_CI                           IDX_T_CI_ID                    NORMAL     NO   VALID    NO   N     2        236         98888     100000      99650 2021-01-22 01:00:30 1      VISIBLE
                     T_CI_ENABLE                    IDX_T_CI_ENABLE_ID             NORMAL     NO   VALID    NO   N     2        236         99472     100000      99648 2021-01-22 01:08:45 1      VISIBLE
                     T_CI_ENABLE1                   IDX_T_CI_ENABLE1_ID            NORMAL     NO   VALID    NO   N     2        236         99472     100000        302 2021-01-22 01:12:00 1      VISIBLE

Note:
表级启用clustor order后,append 直接路径加载,索引的cluster factor为302, 当然CLUF越接近block 说明索引列数据越有序。

对比一下传统insert和insert append不同

SQL> explain plan for insert into t_ci_enable select * from t_ci;

Explained.

SQL> @x2

PLAN_TABLE_OUTPUT
-------------------------------------------------------------------------------------------------------------------------------------------
Plan hash value: 3502766604

------------------------------------------------------------------------------------------------
| Id  | Operation                        | Name        | Rows  | Bytes | Cost (%CPU)| Time     |
------------------------------------------------------------------------------------------------
|   0 | INSERT STATEMENT                 |             |   100K|  1660K|   103   (1)| 00:00:01 |
|   1 |  LOAD TABLE CONVENTIONAL         | T_CI_ENABLE |       |       |            |          |
|   2 |   OPTIMIZER STATISTICS GATHERING |             |   100K|  1660K|   103   (1)| 00:00:01 |
|   3 |    TABLE ACCESS FULL             | T_CI        |   100K|  1660K|   103   (1)| 00:00:01 |
------------------------------------------------------------------------------------------------

10 rows selected.

SQL> explain plan for insert /*+append*/ into t_ci_enable1 select * from t_ci;
Explained.

SQL> @x2
PLAN_TABLE_OUTPUT
-------------------------------------------------------------------------------------------------------------------------------------------
Plan hash value: 3859407412

---------------------------------------------------------------------------------------------------------
| Id  | Operation                        | Name         | Rows  | Bytes |TempSpc| Cost (%CPU)| Time     |
---------------------------------------------------------------------------------------------------------
|   0 | INSERT STATEMENT                 |              |   100K|  1660K|       |   656   (1)| 00:00:01 |
|   1 |  LOAD AS SELECT                  | T_CI_ENABLE1 |       |       |       |            |          |
|   2 |   OPTIMIZER STATISTICS GATHERING |              |   100K|  1660K|       |   656   (1)| 00:00:01 |
|   3 |    SORT ORDER BY                 |              |   100K|  1660K|  2760K|   656   (1)| 00:00:01 |
|   4 |     TABLE ACCESS FULL            | T_CI         |   100K|  1660K|       |   103   (1)| 00:00:01 |
---------------------------------------------------------------------------------------------------------
11 rows selected.

Note:
增加了sort order by .

对第一个已创建表维护增加Attribute Clustering属性。

SQL> alter table t_ci add clustering by linear order(id);
Table altered.

SQL> alter table t_ci  move online;
Table altered.

SQL> @gts t_ci
Gather Table Statistics for table t_ci...
PL/SQL procedure successfully completed.

SQL> @ind t_ci
Display indexes where table or index name matches %t_ci%...

TABLE_OWNER          TABLE_NAME                     INDEX_NAME                     POS# COLUMN_NAME                    DSC
-------------------- ------------------------------ ------------------------------ ---- ------------------------------ ----
ANBOB                T_CI                           IDX_T_CI_ID                       1 ID
                     T_CI_ENABLE                    IDX_T_CI_ENABLE_ID                1 ID
                     T_CI_ENABLE1                   IDX_T_CI_ENABLE1_ID               1 ID


INDEX_OWNER          TABLE_NAME                     INDEX_NAME                     IDXTYPE    UNIQ STATUS   PART TEMP  H     LFBLKS           NDK   NUM_ROWS       CLUF LAST_ANALYZED       DEGREE VISIBILIT
-------------------- ------------------------------ ------------------------------ ---------- ---- -------- ---- ---- -- ---------- ------------- ---------- ---------- ------------------- ------ ---------
ANBOB                T_CI                           IDX_T_CI_ID                    NORMAL     NO   VALID    NO   N     2        236         98888     100000        302 2021-01-22 01:29:55 1      VISIBLE
                     T_CI_ENABLE                    IDX_T_CI_ENABLE_ID             NORMAL     NO   VALID    NO   N     2        236         99472     100000      99648 2021-01-22 01:08:45 1      VISIBLE
                     T_CI_ENABLE1                   IDX_T_CI_ENABLE1_ID            NORMAL     NO   VALID    NO   N     2        236         99472     100000        302 2021-01-22 01:12:00 1      VISIBLE

Note:
可见启用该特性后,move重组后的数据,cluster factor 同样也只有302.

— enjoy —

Troubleshooting Performance event ‘control file sequential read’

$
0
0

前段时间整理过关于control file的一个等待《Troubleshooting performance event ‘enq: CF – contention’》, 这里再记录关于control file的另一个event( 这里没用等待), 此event只是通知类event,和db file sequential read类似为数据库的I/O类操作,但wait class并非USER I/O,而是SYSTEM I/O. 问题时段control file sequential read占到了AWR top 1 event.

常见于:

    1. making a backup of the controlfiles – rman in process
    2. sharing information (between instances) from the controlfile – RAC system
    3. reading other blocks from the controlfiles
    4. reading the header block
    5. High DML periods
    6. poor disk performance
    7. Too many control files
    8. frequent COMMIT

因为控制文件中记录着最后transaction的SCN,所以在OLTP类型数据库中需要频繁的更新,但通常是小i/o,但一般也很少在top event中出现,这个案例(oracle 19c RAC)中下面的AWR看到问题时间段control file sequential read占用约90%的DB TIME,比较异常。

注意: control file sequential read 问题比较突出,一小时内等待了308K sec DB TIME,并均单次wait 达36.67 ms 有些慢. 但是db file sequential read和direct path read 都小于5ms,log file parallel write 也是5ms左右。有时control file wait伴随出现log file switch (archiving needed)也是受control file sequential read影响.  当然I/O Wait avg有时定位问题过于粗糙,需要通过AWR中的Wait Event Histogram 继续分析event 分布。

IOSTAT BY FILETYE SUMMARY 可以看出1小时时间内controlfile read约130GB, control file write 45M,,意味control file 读是非常的大。

分析思路:

1, 检查control file大小

 select v.*, round(block_size*file_size_blks/1024/1024, 2) MB from v$controlfile v;
 select v.*, round(record_size*records_total/1024/1024, 2) MB from v$controlfile_record_section v order by MB desc;
 select * from v$parameter where name = 'control_file_record_keep_time';

检查结果几十MB还可以接受,有些案例是因为keep time为1年,导致contolfile文件为几百MB, 可以从v$controlfile_record_section查询占用条目。
2, 和正常时间点对比control file iostat

从异常时间点和正常时间点AWR中对比control file 相关evvent waits和IOStat by Filetype summary, 发现正常时1小时也有800多万次wait,但是平时AWR 控制文件读avg time为300 us, 所以判断问题时是I/O 比平时慢了。

3, 分析I/O性能

调取问题时间段的OSW或nmon查看iostat信息,是否存储磁盘出现io 性能问题,还要注意cpu 资源,因为cpu枯竭时,同样会影响I/O 响应时间。是否有多个控制文件存在同一磁盘?是否在存在hot block?

SELECT event, wait_time, p1, p2, p3 
FROM gv$session_wait WHERE event LIKE '%control%';

SELECT event,p1, p2,sql_id,count(*) 
FROM gv$active_session_history WHERE event LIKE '%control%'
 group by event,p1,p2,sql_id;

查询结果CPU空闲,部分disk busy较高。

control file sequential read 可以看出主要集中在39-42# block. 1#为 file header。

4, 查找对应的session , SQL,分析执行计划

从AWR/ASH rpt或ASH 裸数据分析event对应session信息和相关SQL, 是否存在执行计划变化或不优?

从上面 step 3的结果也能发现top SQL, 该SQL主查是监控表空间使用率,session信息为Prometheus监控工具 频率调用。SQL确实存在执行计划不优,而且使用了hint 绑定,收集system statistics 去掉SQL hint后测试效率更佳,当然优化这条SQL不在本篇范围内。错误的join方式导致control file sequential read 更高。

从ASH 裸数据中我们还能定位到event wait的执行计划SQL_PLAN_LINE_ID行数和对应的对象为x$kccfn. (fixed full scan),是监控temp file使用$TEMP_SPACE_HEADER。

Control file物理读

X$中kcc开头的来自控制文件,读取control file的记录通常是每次phyical read,并不做cache,下面做个测试.

select * from v$fixed_view_definition where lower(view_definition) like '%x$kcc%'; 

如v$tablespace,v$dbfile ,v$tempfile, v$datafile,gv$archive, 正如这个案例中是一个常用的查询表空间使用率的SQL,
查询了dba_data_file和DBA_TEMP_FILES,$TEMP_SPACE_HEADER等
依赖关系dba_data_files 基于v$dbfile 基于gv$dbfile 基于x$kccfn  更多内容可以查看《ASM Metadata and Internals》

session级打开10046 event,2次或多次查询x$KCCFN 查看control file read block.
select * from x$kccfn;

$cat /..._ora_1841.trc|grep "control file sequential read"
WAIT #140285876517504: nam='control file sequential read' ela= 14 file#=0 block#=1 blocks=1 obj#=-1 tim=67389713130731  
WAIT #140285876517504: nam='control file sequential read' ela= 4 file#=0 block#=15 blocks=1 obj#=-1 tim=67389713130755
WAIT #140285876517504: nam='control file sequential read' ela= 4 file#=0 block#=17 blocks=1 obj#=-1 tim=67389713130769
WAIT #140285876517504: nam='control file sequential read' ela= 5 file#=0 block#=90 blocks=1 obj#=-1 tim=67389713130785
WAIT #140285876517504: nam='control file sequential read' ela= 5 file#=0 block#=92 blocks=1 obj#=-1 tim=67389713131972

WAIT #140285876517504: nam='control file sequential read' ela= 12 file#=0 block#=1 blocks=1 obj#=-1 tim=67389714364091
WAIT #140285876517504: nam='control file sequential read' ela= 6 file#=0 block#=15 blocks=1 obj#=-1 tim=67389714364128
WAIT #140285876517504: nam='control file sequential read' ela= 5 file#=0 block#=17 blocks=1 obj#=-1 tim=67389714364152
WAIT #140285876517504: nam='control file sequential read' ela= 7 file#=0 block#=90 blocks=1 obj#=-1 tim=67389714364177
WAIT #140285876517504: nam='control file sequential read' ela= 7 file#=0 block#=92 blocks=1 obj#=-1 tim=67389714365201

TIP:
发现每次control file read都是相同的物理读,相同的文件和块号,当然controlfile 文件号不同于datafile总为0,但block号也是能看出。如果对比session stat也能发现session级的physical read total IO requests是增涨的,但是physical reads并不会增加。

ASM Fine Grained Striping细粒度条带

ASM 提供了2种上条带,一是Coarse 粒度为1AU 也可以认为不做条带,用完一AU再用下一AU; 另一种是Fine Grained细粒度为了更加分散文件分布和降低IO延迟,可以指定几个 AU做条带,单次IO大小,有两个参数控制,默认为IO大小128k。如1MB AU SIZE, 条带宽度为2,大小为128k,使用分布如下图。

SQL> @p stripe
NAME VALUE
---------------------------------------- ----------------------------------------
_asm_stripewidth 2
_asm_stripesize 131072

根据contro file block找DISK.

如本案例中先不说SQL效率问题,明显是有I/O变慢导致control file sequential read等待更加显著, 上面已定位到为40# 相邻的 block. 下面我们找出控制文件40# block所在的disk ,然后查看该disk的性能。该库使用的ASM存储,并且controlfile 在ASM中默认使用的为细粒度条带化(在10g时online redo同样使用细粒度, 11g开始仅control file),这让确认相对麻烦一些。

  1* select * from v$controlfile

STATUS  NAME                                               IS_ BLOCK_SIZE FILE_SIZE_BLKS     CON_ID
------- -------------------------------------------------- --- ---------- -------------- ----------
        +DATADG/ANBOB/CONTROLFILE/current.678.995708357  NO       16384           3372          0
        +DATADG/ANBOB/CONTROLFILE/current.677.995708357  NO       16384           3372          0
        +DATADG/ANBOB/CONTROLFILE/current.676.995708357  NO       16384           3372          0
OR
SQL> show parameter control

PARAMETER_NAME                       TYPE        VALUE
------------------------------------ ----------- ----------------------------------------------------------------------------------------------------
_sql_plan_directive_mgmt_control     integer     0
control_file_record_keep_time        integer     31
control_files                        string      +DATADG/ANBOB/CONTROLFILE/current.678.995708357, +DATADG/ANBOB/CONTROLFILE/current.677.995708357
                                                 , +DATADG/ANBOB/CONTROLFILE/current.676.995708357
control_management_pack_access       string      DIAGNOSTIC+TUNING

SQL> select GROUP_NUMBER,FILE_NUMBER,BLOCK_SIZE,BLOCKS,BYTES,TYPE,REDUNDANCY,STRIPED from v$asm_file where type='CONTROLFILE';

GROUP_NUMBER FILE_NUMBER BLOCK_SIZE     BLOCKS      BYTES TYPE                 REDUND STRIPE
------------ ----------- ---------- ---------- ---------- -------------------- ------ ------
           2         676      16384       3373   55263232 CONTROLFILE          UNPROT FINE
           2         677      16384       3373   55263232 CONTROLFILE          UNPROT FINE
           2         678      16384       3373   55263232 CONTROLFILE          UNPROT FINE

或使用
SQL> select * from v$asm_alias where file_number in(select  FILE_NUMBER  from v$asm_file where type='CONTROLFILE');

NAME                              GROUP_NUMBER FILE_NUMBER FILE_INCARNATION ALIAS_INDEX ALIAS_INCARNATION PARENT_INDEX REFERENCE_INDEX A S     CON_ID
--------------------------------- ------------ ----------- ---------------- ----------- ----------------- ------------ --------------- - - ----------
Current.676.995708357                        2         676        995708357         164                 5     33554591        50331647 N Y          0
Current.677.995708357                        2         677        995708357         163                 5     33554591        50331647 N Y          0
Current.678.995708357                        2         678        995708357         162                 5     33554591        50331647 N Y          0

-- 查询ASM DG
SQL> select * from v$asm_diskgroup;

GROUP_NUMBER NAME       SECTOR_SIZE LOGICAL_SECTOR_SIZE BLOCK_SIZE ALLOCATION_UNIT_SIZE STATE       TYPE     TOTAL_MB    FREE_MB
------------ ---------- ----------- ------------------- ---------- -------------------- ----------- ------ ---------- ----------
           1 ARCHDG             512                 512       4096              4194304 CONNECTED   EXTERN    2097152    2078468
           2 DATADG             512                 512       4096              4194304 CONNECTED   EXTERN   50331648    4105196
           3 MGMT               512                 512       4096              4194304 MOUNTED     EXTERN     102400      62044
           4 OCRDG              512                 512       4096              4194304 MOUNTED     NORMAL      10240       9348

我们以file 676为例
— ASM FILE对应的file directory

  1* select group_number,disk_number,path from v$asm_disk where group_number=2 and disk_number=0

GROUP_NUMBER DISK_NUMBER PATH
------------ ----------- ------------------------------
           2           0 /dev/asm-disk1

# find file directory second au 
grid@anbob:~$kfed read /dev/asm-disk1|egrep 'f1b1|au'
kfdhdb.ausize:                  4194304 ; 0x0bc: 0x00400000
kfdhdb.f1b1locn:                     10 ; 0x0d4: 0x0000000a
kfdhdb.f1b1fcn.base:                  0 ; 0x100: 0x00000000
kfdhdb.f1b1fcn.wrap:                  0 ; 0x104: 0x00000000

# find disk directory 
grid@anbob:~$kfed read /dev/asm-disk1 aun=10 aus=4194304 blkn=1|grep au|grep -v 4294967295
kfffde[0].xptr.au:                   10 ; 0x4a0: 0x0000000a
kfffde[1].xptr.au:               121954 ; 0x4a8: 0x0001dc62
grid@anbob:~$kfed read /dev/asm-disk1 aun=10 aus=4194304 blkn=1|grep disk|grep -v 65535
kfffde[0].xptr.disk:                  0 ; 0x4a4: 0x0000
kfffde[1].xptr.disk:                 21 ; 0x4ac: 0x0015

file directory metadate位置有disk 0 au 10,disk 21 au 121954, 因为AU SIZE 4MB, metadata block size 4096,ASM为了管理方便会给每个文件目录分配一个唯一的编号,并且会在第一个文件目录的AU里面为其分配1个4k的block来存放它分配的AU情况。 所以一个AU SIZE可以记录4M/4K =1024个 file directory, 我们的676# file在第一个AU 中,也就是disk0 au10.

— 从file directory 查找676# FILE的AU 分布

grid@anbob:~$kfed read /dev/asm-disk1 aun=10 aus=4194304 blkn=676|grep disk|grep -v ffff
kfffde[0].xptr.disk:                  6 ; 0x4a4: 0x0006
kfffde[1].xptr.disk:                 43 ; 0x4ac: 0x002b
kfffde[2].xptr.disk:                 26 ; 0x4b4: 0x001a
kfffde[3].xptr.disk:                 15 ; 0x4bc: 0x000f
kfffde[4].xptr.disk:                  3 ; 0x4c4: 0x0003
kfffde[5].xptr.disk:                 10 ; 0x4cc: 0x000a
kfffde[6].xptr.disk:                 20 ; 0x4d4: 0x0014
kfffde[7].xptr.disk:                 41 ; 0x4dc: 0x0029
kfffde[8].xptr.disk:                 28 ; 0x4e4: 0x001c
kfffde[9].xptr.disk:                  2 ; 0x4ec: 0x0002
kfffde[10].xptr.disk:                40 ; 0x4f4: 0x0028
kfffde[11].xptr.disk:                47 ; 0x4fc: 0x002f
kfffde[12].xptr.disk:                42 ; 0x504: 0x002a
kfffde[13].xptr.disk:                17 ; 0x50c: 0x0011
kfffde[14].xptr.disk:                27 ; 0x514: 0x001b
kfffde[15].xptr.disk:                18 ; 0x51c: 0x0012
grid@anbob:~$kfed read /dev/asm-disk1 aun=10 aus=4194304 blkn=676|grep au|grep -v ffff
kfffde[0].xptr.au:                    3 ; 0x4a0: 0x00000003
kfffde[1].xptr.au:                    3 ; 0x4a8: 0x00000003
kfffde[2].xptr.au:                    2 ; 0x4b0: 0x00000002
kfffde[3].xptr.au:                    8 ; 0x4b8: 0x00000008
kfffde[4].xptr.au:                    2 ; 0x4c0: 0x00000002
kfffde[5].xptr.au:                   10 ; 0x4c8: 0x0000000a
kfffde[6].xptr.au:                    3 ; 0x4d0: 0x00000003
kfffde[7].xptr.au:                    3 ; 0x4d8: 0x00000003
kfffde[8].xptr.au:               213918 ; 0x4e0: 0x0003439e
kfffde[9].xptr.au:               213929 ; 0x4e8: 0x000343a9
kfffde[10].xptr.au:              213922 ; 0x4f0: 0x000343a2
kfffde[11].xptr.au:              213927 ; 0x4f8: 0x000343a7
kfffde[12].xptr.au:              213922 ; 0x500: 0x000343a2
kfffde[13].xptr.au:              213923 ; 0x508: 0x000343a3
kfffde[14].xptr.au:              213928 ; 0x510: 0x000343a8
kfffde[15].xptr.au:              213921 ; 0x518: 0x000343a1

SQL> @p stripe

NAME                                     VALUE
---------------------------------------- ----------------------------------------
_asm_stripewidth                         8
_asm_stripesize                          131072

可以看到676# file分配了16个AU, 当前的细粒度宽度为8,刚好为2组AU.

— 验证一个AU内容是否为控制文件内容

SQL> select group_number,disk_number,path from v$asm_disk where disk_number=6;

GROUP_NUMBER DISK_NUMBER PATH
------------ ----------- ------------------------------
           2           6 /dev/asm-disk15
		   
# dd if=/dev/asm-disk15 bs=4194304 skip=3 count=1|strings|more

...
+DATADG/ANBOB/DATAFILE/netm_dat.458.995715183
+DATADG/ANBOB/DATAFILE/netm_dat.459.995715187
+DATADG/ANBOB/DATAFILE/rpt_bill.460.995715311
+DATADG/ANBOB/DATAFILE/netm_dat.461.995715315
+DATADG/ANBOB/DATAFILE/netm_dat.462.995715315
+DATADG/ANBOB/DATAFILE/rpt_bill.463.995715317
+DATADG/ANBOB/DATAFILE/netm_dat.464.995715441
+DATADG/ANBOB/DATAFILE/netm_dat.465.995715441
+DATADG/ANBOB/DATAFILE/rpt_bill.466.995715441
+DATADG/ANBOB/DATAFILE/netm_dat.467.995715441
+DATADG/ANBOB/DATAFILE/netm_dat.468.995715567
+DATADG/ANBOB/DATAFILE/rpt_bill.469.995715567
+DATADG/ANBOB/DATAFILE/netm_dat.470.995715567

— 在ASM实例中查询更加容易
如果ASM 实例可用可以直接查询x$kffxp (ASM File eXtent Pointer)

col path for a30
col failgroup for a15
select a.file_number file#,a.name,x.xnum_kffxp extent#,a.group_number group#,d.disk_number disk#,
au_kffxp au#, dg.allocation_unit_size au_size,
decode(x.lxn_kffxp,0,'PRIMARY',1,'MIRROR') TYPE, d.failgroup,d.path
from v$asm_alias a,x$kffxp x, v$asm_disk d, v$asm_diskgroup dg
where x.group_kffxp=a.group_number
and x.group_kffxp=dg.group_number
and x.group_kffxp=d.group_number
and x.disk_kffxp=d.disk_number
and x.number_kffxp=a.file_number
and lower(a.name)=lower('Current.676.995708357')
order by x.xnum_kffxp;
																	  
     FILE# NAME                             EXTENT#     GROUP#      DISK#        AU#    AU_SIZE TYPE    FAILGROUP       PATH                      
---------- ---------------------------------------- ---------- ---------- ---------- ---------- ------- --------------- ---------------------------------
       676 Current.676.995708357                  0          2          6          3    4194304 PRIMARY DATADG_0006     /dev/asm-disk15           
       676 Current.676.995708357                  1          2         43          3    4194304 PRIMARY DATADG_0043     /dev/asm-disk5            
       676 Current.676.995708357                  2          2         26          2    4194304 PRIMARY DATADG_0026     /dev/asm-disk33           
       676 Current.676.995708357                  3          2         15          8    4194304 PRIMARY DATADG_0015     /dev/asm-disk23           
       676 Current.676.995708357                  4          2          3          2    4194304 PRIMARY DATADG_0003     /dev/asm-disk12           
       676 Current.676.995708357                  5          2         10         10    4194304 PRIMARY DATADG_0010     /dev/asm-disk19           
       676 Current.676.995708357                  6          2         20          3    4194304 PRIMARY DATADG_0020     /dev/asm-disk28           
       676 Current.676.995708357                  7          2         41          3    4194304 PRIMARY DATADG_0041     /dev/asm-disk47           
       676 Current.676.995708357                  8          2         28     213918    4194304 PRIMARY DATADG_0028     /dev/asm-disk35           
       676 Current.676.995708357                  9          2          2     213929    4194304 PRIMARY DATADG_0002     /dev/asm-disk11           
       676 Current.676.995708357                 10          2         40     213922    4194304 PRIMARY DATADG_0040     /dev/asm-disk46           
       676 Current.676.995708357                 11          2         47     213927    4194304 PRIMARY DATADG_0047     /dev/asm-disk9            
       676 Current.676.995708357                 12          2         42     213922    4194304 PRIMARY DATADG_0042     /dev/asm-disk48           
       676 Current.676.995708357                 13          2         17     213923    4194304 PRIMARY DATADG_0017     /dev/asm-disk25           
       676 Current.676.995708357                 14          2         27     213928    4194304 PRIMARY DATADG_0027     /dev/asm-disk34           
       676 Current.676.995708357                 15          2         18     213921    4194304 PRIMARY DATADG_0018     /dev/asm-disk26           

16 rows selected.

ASMCMD>  mapextent '+DATADG/ANBOB/CONTROLFILE/current.676.995708357' 0
Disk_Num         AU      Extent_Size
6                3               1
ASMCMD>  mapextent '+DATADG/ANBOB/CONTROLFILE/current.676.995708357' 1
Disk_Num         AU      Extent_Size
43               3               1

ASMCMD> mapau 2 43 3
File_Num         Extent          Extent_Set
676              1               1
ASMCMD>        

— 计算control file 676 block 40#在哪个AU上

(block#) 40 * (confile file block size) 16k/ (_asm_stripewidth) 128k=5. 第1条带的第5个AU 上,第1个128k.

AU AU ext0 AU ext1 AU ext2 AU ext3 AU ext4 AU ext5 AU ext6 AU ext7
DISK.AU 6.3 43.3 26.2 15.8 3.2 10.1 20.3 41.3
strips size 128k 128k 128k 128k 128k 128k 128k 128k
ctl block# 0-7 8-15 14-23 24-31 32-40

如果验证我们确认这个位置是确实是我们推算的值?dump block

SQL> select group_number,disk_number,path from v$asm_disk where disk_number=6 and group_number=2;

GROUP_NUMBER DISK_NUMBER PATH
------------ ----------- ------------------------------
           2           6 /dev/asm-disk15

grid@anbob:~$dd if=/dev/asm-disk15  bs=4194304 skip=3 count=1  |dd bs=128k count=1 |dd bs=16384 count=1 |hexdump -C
00000000  00 c2 00 00 00 00 c0 ff  00 00 00 00 00 00 00 00  |................|
00000010  ea 76 00 00 00 40 00 00  2c 0d 00 00 7d 7c 7b 7a  |.v...@..,...}|{z|
00000020  00 00 00 00 00 00 00 00  00 00 00 00 00 00 00 00  |................|
*

grid@anbob:~$dd if=/dev/asm-disk15  bs=4194304 skip=3 count=1  |dd bs=128k count=1 |dd bs=16384 count=1 skip=7|hexdump -C
00000000  15 c2 00 00 07 00 00 00  00 00 00 00 00 00 01 04  |................|
00000010  ed 2c 00 00 00 00 00 00  00 00 00 00 00 00 00 00  |.,..............|
00000020  00 00 00 00 00 00 00 00  00 00 00 00 00 00 00 00  |................|
*

SQL>  select group_number,disk_number,path from v$asm_disk where disk_number=3 and group_number=2;

GROUP_NUMBER DISK_NUMBER PATH
------------ ----------- ------------------------------
           2           3 /dev/asm-disk12

grid@anbob:~$dd if=/dev/asm-disk12  bs=4194304 skip=2 count=1  |dd bs=128k count=1 |dd bs=16384 count=1 |hexdump -C
00000000  15 c2 00 00 20 00 00 00  00 00 00 00 00 00 01 04  |.... ...........|
00000010  ca 2c 00 00 00 00 00 00  00 00 00 00 00 00 00 00  |.,..............|


grid@anbob:~$dd if=/dev/asm-disk12  bs=4194304 skip=2 count=1  |dd bs=128k count=1 |dd bs=16384 count=1 skip=7|hexdump -C
00000000  15 c2 00 00 27 00 00 00  9d 47 d8 3c ff ff 01 04  |....'....G.<....|
00000010  c1 e1 00 00 00 00 40 2b  04 f1 2a 00 00 00 00 00  |......@+..*.....|
00000020  0b 00 00 00 00 00 00 00  00 00 00 00 00 00 00 00  |................|
00000030  00 00 41 00 00 00 00 00  40 00 00 00 00 00 00 00  |..A.....@.......|

TIP:
block 的4-7字节是rdba, 转换成块号刚好是40#(0x27) block,因为是从0开始的。 这样也就确实了物理disk和具体位置。

查看DISK 性能

然后就可以根据ASM DISK查找映射的disk device. 用iostat查看IO性能

发现control file 40 block对应的磁盘当时read/s 214 w/s 16 应该是达到了单盘的最大iops, avgqu-size和awwait ,%util出现较高的值,确认该磁盘出现较高的瓶颈,有必要检查一下队列尝试,出现了较高的hot disk.  这个问题先记录到这里。

— enjoy —


‘sed’ bug? couldn’t close : Permission denied

$
0
0

On SLES 12 sp4, a shell  call sed with ‘-i’ flag   to modify the file execution and report an errort,  This shell worked well on the previous server, The linux user (tried also with root) can create, read and update any files in the NFS mounted folder. But the temporary file created by sed doesn’t work.

cbs@anbob:~/roamingfile> seq 1 5 >text.txt
cbs@anbob:~/roamingfile> id
uid=2001(cbs) gid=6601(onip) groups=6601(onip),100(users),2000(timesten),2001(ttadmin),2002(cbsadm),2003(dba),2004(oinstall)
cbs@anbob:~/roamingfile> sed -i '1d' 123.txt
sed: couldn't close <unknown>: Permission denied

cbs@anbob:~/roamingfile> sed --version
sed (GNU sed) 4.2.2

Note:
If the permission problem usually occurs in the open phase, here is the prompt close, Using strace tracking this show the error is reported when the file generated temporarily by sed try to close.(note root user work fine)

It works well after changing to another version of sed(SLES 11)

 
cbs@anbob:~/roamingfile> /another_release/sed -i '1d' 123.txt
cbs@anbob:~/roamingfile>
cbs@anbob:~/roamingfile> cat 123.txt 
2 
3 
4 
5
cbs@anbob:~/roamingfile> /another_release/sed --version
GNU sed version 4.1.5
Copyright (C) 2003 Free Software Foundation, Inc.
This is free software; see the source for copying conditions.  There is NO
warranty; not even for MERCHANTABILITY or FITNESS FOR A PARTICULAR PURPOSE,
to the extent permitted by law.

There are reasons to suspect that this is a bug in the current sed, and you can use other ksh to report an error.

Troubleshooting Select 产生Redo分析案例

$
0
0

众所周知, 在oracle数据库中redo日志是非常重要的文件,oracle代码设计根据Write-Ahead-Logging预写协议,DBW不会在LGWR写入描述该块更改方式的redo之前将已更改的块写入磁盘, redo 日志文件中记录了所有的数据库变化,通常对于Select 查询类并不会修改数据,也不应该产生redo 记录,但是还是有几种特殊场景, 前几日一个客户提出疑问,他注意到在数据库SQLPLUS中set autotrace on中执行一条查询总是出现大量的redo和伴随physical read, 环境Oracle 11.2.0.4 RAC on AIX.

现象

如下:

SQL> set autotrace on
SQL> select /*+full(a) */ count(buss_id) from  ANBOB.TAB_LARGE_TABLE_LOG a;
COUNT(BUSS_ID)
-------------------
      19721478
	  
Execution Plan
----------------------------------------------------------------------------------------
Plan hash value: 3388132658
| Id  | Operation          | Name                | Rows  | Bytes | Cost (%CPU)|Time     |
------------------------------------------------------------------------------------------
|   0 | SELECT STATEMENT   |                     |     1 |     5 |   147K  (1)|00:29:29 |
|   1 |  SORT AGGREGATE    |                     |     1 |     5 |            |         |
|   2 |   TABLE ACCESS FULL| TAB_LARGE_TABLE_LOG |    19M|    93M|   147K  (1)|00:29:29 |
------------------------------------------------------------------------------------------

Statistics
------------------------------------------
          0  recursive calls
          0  db block gets
     864313  consistent gets
     805988  physical reads
   23439672  redo size
        535  bytes sent via SQL*Net to client
        520  bytes received via SQL*Net from client
          2  SQL*Net roundtrips to/from client
          0  sorts (memory)
          0  sorts (disk)
          1  rows processed

Note:
执行计划使用full table scan,表中约有2000万记录,产生了23M的redo, 805988物理读,864313逻辑读。连续第二次执行同样又60万物理读和18M redo size。

猜测

遇到该问题时我们先大胆的猜测,如果凭经验select产生redo多数是与延迟块清除(delayed block cleanout)有关,物理读原因要么是使用了直接路径读(direct path read), 因为直接路径读是直接把数据从磁盘读取到PGA中,不会把block内容写回磁盘,所以多次读取相同的块也会反复的做块清除.(MOS 1925688.1记录了此行为), 但是注意如果再次查询如采用直接路径读取,如果表记录没有改变有可能相同数目的延迟块清除操作,direct path read的清除操作仅是针对从磁盘上读取到PGA内存中的block image,而不对实际disk上的块做任何修改,因而也不会任何redo;

————————————————————————————————————————————————————–

注:Select会产生延迟块清除生成redo。如果一个事务,由于部分block在commit之前已经写回datafile(如flush buffer_cache), 或者事务修改的block数过多,则commi的时候只会清理undo segment header中的事务表信息,data block上的ITL事务 flag不会清除,否则因为commit时已刷到disk上的block再加载一次内存代价过高。那么在下一次读取这些block时,需要将block ITL中的事务flag进行清除,就发生了select还将“修改”这些修改后的block而产生redo。

PostgreSQL也实现了类似Oracle的延迟块清除工作,如果一个数据块被读到内存中,做多版本判断时发现其中的行记录的事务都已提交的,会给行记录设置一个标志位表示该记录可见的,以后不需要再到commit log中去查看其事务状态,所以PostgreSQL与Oracle数据库一样,一些select操作也会产生一些写I/O.

————————————————————————————————————————————————————–

另一种情况是因为使用了全表扫描(FULL TABLE SCAN),全表扫块会把block放到Buffer cache LRU的冷端,对于ORACLE多进程共用buffer cache系统,读取新的块数量较多的情况下,后续读取的块有可能把之前cached block置换出去,导致每次读取都会有不同量物理读, 但是这种也不会产生redo,需要配合大量的表数据更新和延迟块清除,通过dba_tab_modifications表判断一下该表时间段内是否有UPDATE操作;

另一种情况是select构造CR块,如会话1对表做了DML修改,未提交前,会话2对表执行查询需要构造CR block,修改内存中的数据块,产生REDO;

其他还有select查询触发了递归SQL,如审计、trigger产生了其它事务,产生了redo,这种需要配合10046\SQL trace跟踪;

如果没有一套完整的运维工具,对日常DBA知识库积累到软件中,很难在第一时间考虑周全,尤其是在Oracle不同版本中有些特性的变化DBA也未必能快速的做出判断,以上的猜测全吗?当然不,这个案例就是另一种可能,也许还有各种原因, 但是有了猜测我们就有了初步的验证方向, 然后去验证,毕竟过程才是对DBA成长更有帮助。 Why guess when you can kown?

分析方法

对于性能故障,通常应该把Top SQL , Top event作为故障诊断的起点,但是故障诊断并未结束,有时还需要从session statistics结合指标分析,这点是其它数据库无法和ORACLE 数据库媲美的,在oracle 19c中session 级的状态指标已达2000有余。因此Top event无法很好地解释问题时,您要更深入地研究性能数据,更甚oracle提供大量的diag event, 揭开oracle这个黑盒中部分神秘功能的面纱。

想要了解会话级性能数据的通常使用的数据及其顺序:
1, TOP Event/ TOP SQL
2, V$SESSTAT Statistics
3, Dump trace

有时候看#1就足够了,经常需要看#1和#2,如果还无法解释时需要看#3。#3需要更高级的诊断能力和内部资料,如需要如何阅读sql trace, 10053 trace, hanganalyze, systemstate, processtate , file dump …

所以我习惯在诊断性能问题时使用TanelPoder的snapper工具,同样也我推荐给大家,可以同时取得#1和#2的session 数据。

像本案例的redo问题,如果#1和#2没有办法确认原因, 我们可以dump 该时段的redo file,但是也需要一些小技巧,如在做dump 前先做一次log file switch , 然后多次连续的执行上面的产生redo的查询,再dump redo,阅读更加关注的内容, redo logfile中有 redo OP code, 从网上可以找到一些公开的OP code对应的, 然后自己写一段shell 格式化一下,就可以找出记录占用较高的,对应OP code,如4.1 对应Block cleanout record, 再次确认产生的REDO 内容,也可以尝试logmner工具解析。

案例分析

言归正传,分析上面一条select 产生redo的问题,因为SQL是固定的,当然要先排除有audit或trigger等触发的级联SQL, 可以做10046 event, 在trace中发现都是这个表的物理读,未发现其它对象的,event和查询v$session_event一致,但是注意10046 trace中并不会反映延迟块清除(delay block cleanout),我们先来看TOP event.

SQL> select sid se_sid,event se_event,time_waited/100 se_time_waited,total_waits,total_timeouts,average_wait/100 average_wait,max_wait/100 max_wait 
from v$session_event
where sid in(2663);
    SE_SID SE_EVENT                          SE_TIME_WAITED TOTAL_WAITS TOTAL_TIMEOUTS AVERAGE_WAIT   MAX_WAIT
---------- --------------------------------- -------------- ----------- -------------- ------------ ----------
      2663 Disk file operations I/O                     .01          28              0        .0003        .01
      2663 db file sequential read                      1.2        5556              0        .0002        .03
      2663 db file scattered read                     28.85       22624              0        .0013        .02
      2663 gc cr multi block request                   5.94       15270              0        .0004        .01
      2663 gc cr grant 2-way                            .32        2842              0        .0001          0
      2663 library cache pin                              0           4              0        .0002          0
      2663 library cache lock                             0           4              0        .0002          0
      2663 SQL*Net message to client                      0          16              0            0          0
      2663 SQL*Net message from client                63.79          15              0       4.2529      22.89
      2663 events in waitclass Other                      0           1              0            0          0
10 rows selected.

NOTE:
这里并没有看到direct path read,基本可以排除直接路径读,这个也可以session级修改”_serial_direct_read”=false,在不使用并行的情况问题依旧存在。

第二步我们看Session statistics 从v$sesstat,但是注意v$sesstat是累计值,所以需要取2次v$sesstat值的差异,如果在运行SQL前建议创建新session,这样session stat指标值几乎都为0.

如对于”delayed block cleanout”的通过v$sesstat 查看statistics name 的值:(注意在oracle新版本中有可能名称改变)

– “cleanouts only – consistent read gets”
– “cleanouts and rollbacks – consistent read gets”

如果构建cr块产生redo,通过v$sesstat 查看statistics name的值:

– “data blocks consistent reads – undo records applied “
– “cleanouts and rollbacks – consistent read gets”

不过客户一再表示他们不存在大量的update,当然有些时候为了排除干扰,不要相信认何人说的话,除非你亲眼看到, 因为一开始这个表客户还说此表没有update,但dba_tab_modification确实有。

方法:
—  query v$sesstat #1 on session 2
— run select SQL on session 1
— query v$sesstat #2 on session 2

然后对比差异#2 – #1, 当然为了更好方便,可以创建个global temporary table用于存放两次v$sesstat的数据,SQL对比差异,现场客户反馈的v$sesstat变化数据时过滤掉了值为0的记录,同时也重现了产生redo的现象。

从v$sessstat我们以cleanout为关键字没有找到我们想要的内容,这里篇幅原因只截取了部分关注的,那我们看redo 部分.

— 第一次

       
       SID NAME                                                                  VALUE
---------- ---------------------------------------------------------------- ----------
      2657 physical read total IO requests                                       35024
      2657 physical read total multi block requests                              10560
      2657 physical read total bytes                                        6602653696
      2657 physical reads                                                       805988
      2657 physical reads cache                                                 805988
      2657 physical read IO requests                                             35024
      2657 physical read bytes                                              6602653696
      2657 db block changes                                                         68
      2657 redo entries                                                          35031
      2657 redo size                                                          23449636
      2657 redo entries for lost write detection                                 34290
      2657 redo size for lost write detection                                 22281124
      2657 undo change vector size                                                8676
      2657 data blocks consistent reads - undo records applied                       2
      2657 rollbacks only - consistent read gets                                     2
      2657 table scans (long tables)                                                 1

— run select generate redo SQL 1 times

— 第二次

       SID NAME                                                                  VALUE
---------- ---------------------------------------------------------------- ----------
      2657 physical read total IO requests                                       70194
      2657 physical read total multi block requests                              21038
      2657 physical read total bytes                                        1.3207E+10
      2657 physical reads                                                      1612135
      2657 physical reads cache                                                1612135
      2657 physical read IO requests                                             70194
      2657 physical read bytes                                              1.3207E+10
      2657 db block changes                                                         95
      2657 redo entries                                                          70204
      2657 redo size                                                          46879924
      2657 redo entries for lost write detection                                 69215
      2657 redo size for lost write detection                                 45355776
      2657 redo subscn max counts                                                    1
      2657 undo change vector size                                               11684
      2657 data blocks consistent reads - undo records applied                       6
      2657 rollbacks only - consistent read gets                                     4
      2657 table scans (long tables)                                                 2

Note:
产生了新35173 redo entries,其中34925为for lost write detection,   占用redo size 90%这也就是为什么产生REDO 的原因,其它少量有可能是维护或undo CR操作相关的,  现在主要是lost write detection(写丢失发现).

如果dump redo file可以看到这部分redo record, lost write detection 的redo block 叫做Block read record (BRR), 对应的redo OP code为23.2, dump redo可以使用:

SQL> alter system dump logfile '***redo_log_.log' layer 23 opcode 2;

trace 内容如下:

REDO RECORD - Thread:1 RBA: 0x00000e.00000039.0010 LEN: 0x0060 VLD: 0x14
SCN: 0x0000.0039c159 SUBSCN:  1 02/24/2021 09:52:03
(LWN RBA: 0x00000e.00000039.0010 LEN: 0001 NST: 0001 SCN: 0x0000.0039c159)
CHANGE #1 TYP:0 CLS:4 AFN:4 DBA:0x01008182 OBJ:92352 SCN:0x0000.00398585 SEQ:1 OP:23.2 ENC:0 RBL:0
 Block Read - afn: 4 rdba: 0x01008182 BFT:(1024,16810370) non-BFT:(4,33154)
              scn: 0x0000.00398585 seq: 0x01
              flags: 0x00000004 ( ckval )

写丢失发现功能是否打开? 检查参数

SQL> show parameter DB_LOST_WRITE_PROTECT
NAME VALUE
---------------------------------------- ----------------------------------------
db_lost_write_protect                    TYPICAL

写丢失发现(lost write detection)

写丢失(lost writes):“当I / O子系统确认块写入已完成,而实际上在持久存储中未发生写入时,就会发生数据块丢失写入”,丢失的写操作可能是由存储故障引起的,也有可能RAM中的数据(例如buffer cache)和磁盘存储之间的任何错误引起,也有可能是Oracle bug。 如block x中的值为1,update操作把1值从磁盘读到buffer cache中并修改为2, 然后DBW再把该IO请求发给OS,OS层答复IO完成,实际存储原因丢掉了这个IO,或因为其它原因写入了旧的数据,  那disk上的值还是之前的数据值1,从而导致了写丢失,同时使用rman或dbv并不会发现,因为对于它们旧数据块也是完整的,块本身是一致的,没有损坏。DBA不会注意到它。

lost write detection功能引入用来发现该问题,Dataguard环境,当 主库和备库db_lost_write_protect配置为TYPICAL或FULL时(区别表空间读写类型),primary DB当select时块从disk上读到buffer cache中执行物理读取时,会生成其他redo条目,附加lost write detection需要的信息如block rdba、obj, 改变向量和SCN写入redo log, 据Oracle宣传开启后通常带来的性能负担可以忽略,但是建议先在测试库测试并注意REDO量的增长。然后配合DataGuard去持续的lost write验证,备用数据库上设置DB_LOST_WRITE_PROTECT = TYPICAL,这将使MRP及其恢复从属服务器使用redo日志流中的额外信息来检查丢失的写操作,当发现异常中报错并中止MRP日志应用,需要人工介入修复。

如果想手动模拟这个操作,可以使用dd命令备份、修改、恢复覆盖一个data block达到写丢失的现象,从报错ORA-10567中可以确认block地址, 从MRP进程的trace中也有记录,利用DG 的standby 做为数据库副本检测写丢失,MRP从属将开始通过比较SCN来进行额外的工作以检查丢失的写操作,可以dump redo分析附加在redo中的 BRR,BRR大小不尽相同,预估每个data block物理读大约额外增加30 bytes的REDO,需要评估做primary产生的影响。 分析该特性的session 状态可以查看v$sesstat 中查看%lost%write%统计信息,启用lost write detect 在standby上,无疑增加了额外的物理读,这也就是有些细心的同学发现standby上没有任何业务,但是物理读很高的一种可能,相关的统计信息如下:
– ‘recovery blocks read for lost write detection’
– ‘recovery blocks skipped lost write checks’

在执行介质恢复 (recover database命令)时,还将根据BRR条目中的SCN检查丢失的写操作 。因此即使Data Guard不可用,在18c版本以前也可以使用从备份中对数据库进行的简单还原来执行BRR记录的验证,以检索lost write。 该功能虽然能发现lost write但不是不能启到保护作用,解决比较复杂,MOS中1265884.1提供了解决方法。在Oracle EXDATA中默认是启用了lost write detect,db_lost_write_protect默认值为TYPICAL.

12.1.0.2 版本有个 Bug 28511632   需要注意,如果rman duplicate 搭建standby database时,异常中断可能导致primary db 发生lost write。

18c Shadow Lost Write Protection功能

12cR2 之前,为了持续检测写丢失,必须配置备用数据库,并且在主库和备库都设置 DB_LOST_WRITE_PROTECT 参数,该参数设置TYPICAL后,主库实例会在 redo log 中记录从处于读写模式的表空间中读取的数据块的信息。当备库在恢复过程中应用日志时,会读取相应的数据块信息并和重做日志中记录进行数据块的 SCN 对比,以来检测主库是否有发生写丢失。

Oracle 12c R2引入了一个新特性”Shadow Lost Write Protection”,该特性可以在主库直接进行数据块写丢失检测,而无需配置备用数据库。即使配置了备用数据库,该特性也被证明对于update有益,因为在写丢失发生在持久存储后,任何查询和修改语句要求通过物理读获取这个数据块都会触发写丢失报错。这样可以使 DBA 通过介质恢复来恢复这个数据块(或数据文件/表空间)。这个特性在12c的release 2为了测试的目的而引入的,从18c开始公开可用。

1,创建一个新表空间来存 shadow data,表空间必须创建成为大文件表空间。

2,对某个用户表空间开启写丢失保护之前,需要先在数据库级别上开启写丢失保护,然后再在表空间级开启:

SQL> alter database enable lost write protection;

如果是plugaable database

SQL> alter pluggable database enable lost write protection;
Pluggable database ENABLE altered.

对USERS表空间配置lost write protect

SQL> alter tablespace USERS enable lost write protection;

开启写丢失保护后,当脏数据(USERS 表空间中被更改的块)的数据块从buffer cache写入disk时,oracle 会把数据块的 SCN 写入影子表空间。这些数据可以从动态视图 V$SHADOW_DATAFILE 或它的基表X$SHADOW_DATAFILE 中查询到。

如果发现写丢失时会提示:

ORA-65478: shadow lost write protection - found lost write

同时db alert log中也会提示:

ERROR - I/O type:buffered I/O found lost write in block with file#:nn rdba:0xnnnnnnn, 

注:当这些块在一致性读取期间通过buffer cache读取时,从读取它们的函数中标识了它们x$bh.fp_whr like ‘kr_gcur_4: kcbr_lost_get_lost_w%’

总结:

这个案例因为数据库启用了写丢失发现,所以在一个超大表做全表扫而物理读时,在primary DB select时产生了附加的redo信息,也告诫我们避免过早的猜测,通过获取信息和分析事实,您可以学到更多,分析这类进程级问题时,可以多得用TOP SQL, TOP EVENT和session statistics快照对比的方法,可以较容易分析问题或首选做为分析的起点,同时也可以了解到oracle在不同的版本新功能的引入,及oracle工程机上新鲜事务,让我们学习工作更有激情。


PostgreSQL无效页面和校验(Checksum)和验证失败(Verification Failed)

$
0
0

前几天分享了oracle lost write detection, 后来想找找postgresql有没有相同技术,结果没有找到,但是对于对于PostgreSQL中无效页面(Invalid Page In Block)是有发现机制的, PostgreSQL主要在进出buffer cache的过程中维护页面有效性,PostgreSQL在数据库和操作系统(固件,磁盘,网络,远程存储)之间有强大的”边界”。


假设存在物理内存故障或是其它原因产生无效page,并且ECC(Error Checking and Correcting)奇偶校验无法以某种方式检测到它。这意味着服务器上的少量物理内存现在有不正确的数据,并且该内存中的正确数据也丢失了。

1, 如果不正常的数据在 kernel page cache,那么当PostgreSQL尝试将page复制到其buffer cache时,它将(如果可能)检测到错误,请拒绝加载的8k page 到buffer cache中,出现下面的ERROR消息。

ERROR: invalid page in block 1226710 of relation base/xxxxx/xxxx

2, 如果不正常的数据在PostgreSQL数据库buffer cache的一部分,则PostgreSQL将假设没有错误,并尝试操作buffer cache中的错误数据。结果不可预测;可能会导致各种错误消息,崩溃和故障模式-甚至返回不包含任何错误消息的不正确数据。

PostgreSQL如何检查页面有效性

PostgreSQL在page block上执行两个主要的“有效性检查”。您可以在函数PageIsVerified()中阅读代码,但在此将对其进行总结。您可以从错误消息中得知哪个有效性检查失败。这取决于您是否在错误之前看到了另一个警告。该警告是这样的

WARNING: page verification failed, calculated checksum 3482 but expected 32232

1, 如果不存在以上警告,则表明 page header 未通过基本的健全性检查。 这可能是PostgreSQL内部和外部的问题所引起的。
2, 如果您看到上述警告,则表示block中记录的checksum和与为该block计算的checksum不匹配。 这很可能表明数据库底层存在问题-操作系统,内存,网络,存储等。


在PostgreSQL 13中每页的前24个字节由一个页头(PageHeaderData)组成。Page header data layout详细介绍了其格式。第一个字段跟踪与此页面相关的最新WAL条目。如果启用了数据校验和,则第二个字段包含页面校验

Page Header Data Layout

Field Type Length Description
pd_lsn PageXLogRecPtr 8 bytes LSN: next byte after last byte of WAL record for last change to this page
pd_checksum uint16 2 bytes Page checksum
pd_flags uint16 2 bytes Flag bits
pd_lower LocationIndex 2 bytes Offset to start of free space
pd_upper LocationIndex 2 bytes Offset to end of free space
pd_special LocationIndex 2 bytes Offset to start of special space
pd_pagesize_version uint16 2 bytes Page size and layout version number information
pd_prune_xid TransactionId 4 bytes Oldest unpruned XMAX on page, or zero if none

All the details can be found in src/include/storage/bufpage.h.

–data-checksums
在数据页上使用校验和,以帮助检测I / O系统的损坏,否则这些损坏将是静默的。启用校验和可能会导致明显的性能损失。如果设置,将为所有数据库中的所有对象计算校验和。所有校验和失败都将在pg_stat_database视图中报告。

从版本11开始的PostgreSQL本身具有一个命令行实用程序,用于扫描一个关系或所有内容并验证每个块上的校验和。这就是所谓的pg_verify_checksums在V11和pg_checksums在V12。 缺点:首先,此实用程序要求您在数据库运行之前先关闭它。如果数据库启动,它将引发错误并拒绝运行。其次,您可以扫描单个关系,但是不能说出它在哪个数据库中……因此,如果OID存在于多个数据库中,则无法只扫描您关心的关系。

另外还有一些外部插件如Credativ的高级工程师已经发布了pg_checksums的增强版本,版本可以验证正在运行的数据库上的校验和。

如果报错,我们可以使用UNIX命令转储,检查cksum值

$ dd status=none if=base/xxx/xxx bs=8192 count=1 skip=250 | od -A d -t x1z -w16
0000000 00 00 00 00 e0 df 6b b0 ba 3a 04 00 0c 01 80 01  >......k..:......<
...

另外也可以使用pg_filedump程序查看更详细的信息,类似oracle的BBED read,该实用程序有很多选择。验证校验和(-k),仅以偏移量250(-R 250 250)扫描一个块,甚至将元组(表行数据)解码为人类可读的格式( -D int,int,int,charN)。还有另一个参数(-f)甚至可以告诉pg_filedump内联显示hexdump / od样式的原始数据

$ pg_filedump -k -R 250 250 -D int,int,int,charN base/16385/16492

*******************************************************************
* PostgreSQL File/Block Formatted Dump Utility - Version 11.0
*
* File: base/16385/16492
* Options used: -k -R 250 250 -D int,int,int,charN
*
* Dump created on: Fri Nov  8 21:48:38 2019
*******************************************************************

Block  250 ********************************************************
<Header> -----
 Block Offset: 0x001f4000         Offsets: Lower     268 (0x010c)
 Block: Size 8192  Version    4            Upper     384 (0x0180)
 LSN:  logid      0 recoff 0xb06bdfe0      Special  8192 (0x2000)
 Items:   61                      Free Space:  116
 Checksum: 0x3aba  Prune XID: 0x00000000  Flags: 0x0004 (ALL_VISIBLE)
 Length (including item array): 268

 Error: checksum failure: calculated 0x44ba.

<Data>------
 Item   1 -- Length:  121  Offset: 8064 (0x1f80)  Flags: NORMAL
COPY: 15251	1	0
 Item   2 -- Length:  121  Offset: 7936 (0x1f00)  Flags: NORMAL
COPY: 15252	1	0
 Item   3 -- Length:  121  Offset: 7808 (0x1e80)  Flags: NORMAL
COPY: 15253	1	0

Thanks Jeremy_schneider share your knowledge

x$kcbbes checkpoint

$
0
0

Q: some documentation talks about non-checkpoint based DBWR writes, does anyone know how to produce an example of that?

I’ve only seen writes based on a checkpoint (row in X$ACTIVECKPT) so far.

x$kcbbes Check incremental checkpoints (259586.1)

TanelPoder’s script @kcbbes

SQL> @kcbbes
List background I/O write priorities and reasons from X$KCBBES...
(X$KCBBES = Kerncel Cache Buffers dB writer Event Statistics)

      INDX REASON_NAME            REASON_BUFFERS    REASON% PRIORITY_NAME    PRIORITY_BUFFERS      PRIO% IO_PROC_STATUS             IO_COUNT    STATUS%
---------- ---------------------- -------------- ---------- ---------------- ---------------- ---------- ------------------------ ---------- ----------
         0 Invalid Reason                      0            Invalid Priority                0            Queued For Writing       3982646704         48
         1 Ping Write                     269635          0 High Priority           254978412        3.1 Deferred (log file sync)          0
         2 High Prio Thread Ckpt               0            Medium Priority        4112475022       49.6 Already being written     380103989        4.6
         3 Instance Recovery Ckpt       24999170         .3 Low Priority           3926243756       47.3 Buffer not dirty             109738          0
         4 Med Prio (incr) Ckpt       4087475852       49.3                                 0            Buffer is pinned              87632          0
         5 Aging Writes                        0                                            0            I/O limit reached                 0
         6 Media Recovery Ckpt                 0                                            0            Buffer logically flushed          0
         7 Low Prio Thread Ckpt          3235829          0                                 0            No free IO slots                137          0
         8 Tablespace Ckpt               1091896          0                                 0                                     3930748990       47.4
         9 Reuse Object Ckpt             1122729          0                                 0                                              0
        10 Reuse Block Range Ckpt      164534171          2                                 0                                              0
        11 Limit Dirty Buff Ckpt      3750179631       45.2                                 0                                              0
        12 Smart Scan Ckpt             254708777        3.1                                 0                                              0
        13                                     0                                            0                                              0
        14 Direct Path Read Ckpt         6079500         .1                                 0                                              0
        15                                     0                                            0                                              0
        16                                     0                                            0                                              0
        17                                     0                                            0                                              0
        18                                     0                                            0                                              0

19 rows selected.

Troubleshooting DB session spin call java function

$
0
0

一天客户问有个SQL执行中好像是hang了,环境oracle 19c RAC,当前的session对应的v$session.event是‘gc current grant 2-way ’, 之前运行都是秒级,现在已经跑了1个小时还未结束,通常看到这个event会怀疑是GC出了问题,然后就走错了路, 下面看一下这个案例。

SQL> select username,sid,sql_id,event,seconds_in_wait,state,last_call_et from v$session where sql_id='0ax014ztkh0r4';

USERNAME          SID SQL_ID        EVENT                                                        SECONDS_IN_WAIT STATE                 LAST_CALL_ET
---------- ---------- ------------- ------------------------------------------------------------ --------------- ------------------- --------------
ANBOB_U1         1651 0ax014ztkh0r4 gc current grant 2-way                                                  3834 WAITED SHORT TIME             3836

SQL> select username,sid,sql_id,event,seconds_in_wait,state,last_call_et,blocking_instance,blocking_session from v$session where sql_id='0ax014ztkh0r4';

USERNAME          SID SQL_ID        EVENT                                                        SECONDS_IN_WAIT STATE                 LAST_CALL_ET BLOCKING_INSTANCE BLOCKING_SESSION
---------- ---------- ------------- ------------------------------------------------------------ --------------- ------------------- -------------- ----------------- ----------------
ANBOB_U1         1651 0ax014ztkh0r4 gc current grant 2-way                                                  3898 WAITED SHORT TIME             3900

v$session 和v$session_wait的event是表示不只是当前的wait event,还有可能是上一个(刚刚完成的)event, 如何判断是否当前正在等待呢?state列如果是”WAITING”. 也可以观察WAIT_TIME列,0表未会话当前正在等待,SECONDS_IN_WAIT才是当前等待所花费的时间,从11g以后不再建议使用此列,用另外两列代替,wait_time_micro等待的时间(以微秒为单位),如果会话当前正在等待,则该值为当前等待中花费的时间。如果会话当前不在等待中,则该值为上一次等待中等待的时间。TIME_REMAINING_MICRO 表未当前会话未等待。

上面这个会话当前session.state 是’WAITED SHORT TIME’, 所以该event并不是当前会话的真实wait event, 如果使用我的ase.sql查看活动会话,也不会显示是wait for gc.

下面分析SQL 使用sql monitor 利器

SQL>  select DBMS_SQLTUNE.REPORT_SQL_MONITOR(sql_id=>'&sql_id',report_level=>'ALL',type=>'text')  from dual; 
Enter value for sql_id: 0ax014ztkh0r4

DBMS_SQLTUNE.REPORT_SQL_MONITOR(SQL_ID=>'0AX014ZTKH0R4',REPORT_LEVEL=>'ALL',TYPE=>'TEXT')
--------------------------------------------------------------------------------------------------------------------------------------------------------------------------------------------------------------------------------------------------------------------------------------------------------------------------------------------------------------------------------------------------------------------------------------------------------------------------------------------------------------------
SQL Monitoring Report

SQL Text
------------------------------
UPDATE ANBOB_ENCRYPT_20210315 A SET PASSWORD_NEW = JAVA_ENCRY_F(A.ATTR_VALUE) WHERE PROD_INST_ID_1 = :B1

Global Information
------------------------------
 Status                                 :  EXECUTING
 Instance ID                            :  1
 Session                                :  ANBOB_U1 (1651:36742)
 SQL ID                                 :  0ax014ztkh0r4
 SQL Execution ID                       :  16806606
 Execution Started                      :  03/16/2021 14:52:26
 First Refresh Time                     :  03/16/2021 14:52:32
 Last Refresh Time                      :  03/16/2021 15:53:50
 Duration                               :  3685s
 Module/Action                          :  SQL*Plus/-
 Service                                :  xxxxxxxxxxx
 Program                                :  sqlplus@xxx-11fb-g06-sev-r730-02u22 (TNS V1-V
 PLSQL Entry Ids (Object/Subprogram)    :  1081201,1
 PLSQL Current Ids (Object/Subprogram)  :  1081201,1

Binds
========================================================================================================================
| Name | Position |  Type  |                                           Value                                           |
========================================================================================================================
| :B1  |        1 | NUMBER | 925559560                                                                                 |
========================================================================================================================

Global Stats
===================================================
| Elapsed |   Cpu   |  Java   |  Other   | Buffer |
| Time(s) | Time(s) | Time(s) | Waits(s) |  Gets  |
===================================================
|    3686 |    3681 |    3686 |     4.59 |      5 |  #buffer get 5,cpu time 3681s,java time 3686s
===================================================

SQL Plan Monitoring Details (Plan Hash Value=3801314702)
===============================================================================================================================================
| Id   |      Operation      |           Name           |  Rows   | Cost |   Time    | Start  | Execs |   Rows   | Activity | Activity Detail |
|      |                     |                          | (Estim) |      | Active(s) | Active |       | (Actual) |   (%)    |   (# samples)   |
===============================================================================================================================================
|    0 | UPDATE STATEMENT    |                          |         |      |         1 |     +6 |     1 |        0 |          |                 |
|    1 |   UPDATE            | ANBOB_ENCRYPT_20210315   |         |      |      3686 |     +1 |     1 |        0 |   100.00 | Cpu (3672)      |  
| -> 2 |    INDEX RANGE SCAN | ANBOB_ENCRYPT_20210315_1 |       1 |    1 |      3683 |     +6 |     1 |        1 |          |                 |
===============================================================================================================================================

Note:
session 确实已经running了1个多小时,更新1行,buffer gets 5,  时间都记入了Java TIME.

看session call stack

SQL> oradebug short_stack
ksedsts()+426<-ksdxfstk()+58<-ksdxcb()+872<-sspuser()+200<-__sighandler()<-PassWord__encode()+1753<-sjoninvk_jit()+1041<-joevm_joe_run_jit_somersault()+458<-joe_invoke()+1631<-joet_aux_thread_main()+1674<-seoa_note_stack_outside()+34<-joet_thread_main()+64<-sjontlo_initialize()+178<-joe_enter_vm()+1197<-ioei_call_java()+4716<-ioesub_CALL_JAVA()+569<-seoa_note_stack_outside()+34<-ioe_call_java()+292<-jox_invoke_java_()+4133<-kkxmjexe()+1493<-kgmexcb()+56<-kkxmswu()+91<-kgmexwi()+1011<-kgmexec()+1452<-evapls()+1251<-evaopn2()+737<-upderh()+1252<-upduaw()+193<-kdusru()+617<-kauupd()+356<-updrow()+1693<-qerupUpdRow()+725<-qerupFetch()+644<-updaul()+1416<-updThreePhaseExe()+340<-updexe()+443<-opiexe()+11783<-opipls()+2086<-opiodr()+1202<-rpidrus()+198<-skgmstack()+65<-rpidru()+132<-rpiswu2()+541<-rpidrv()+1248<-psddr0()+467<-psdnal()+624<-pevm_EXECC()+306<-pfrinstr_EXECC()+56<-pfrrun_no_tool()+52<-pfrrun()+902<-plsql_run()+752<-peicnt()+282<-kkxexe()+720<-opiexe()+30719<-kpoal8()+2387<-opiodr()+1202<-ttcpip()+1222<-opitsk()+1897<-opiino()+936<-opiodr()+1202<-opidrv()+1094<-sou2o()+165<-opimai_real()+422<-ssthrdmain()+417<-main()+256<-__libc_start_main()+245 SQL> oradebug short_stack
ksedsts()+426<-ksdxfstk()+58<-ksdxcb()+872<-sspuser()+200<-__sighandler()<-PassWord__encode()+2131<-sjoninvk_jit()+1041<-joevm_joe_run_jit_somersault()+458<-joe_invoke()+1631<-joet_aux_thread_main()+1674<-seoa_note_stack_outside()+34<-joet_thread_main()+64<-sjontlo_initialize()+178<-joe_enter_vm()+1197<-ioei_call_java()+4716<-ioesub_CALL_JAVA()+569<-seoa_note_stack_outside()+34<-ioe_call_java()+292<-jox_invoke_java_()+4133<-kkxmjexe()+1493<-kgmexcb()+56<-kkxmswu()+91<-kgmexwi()+1011<-kgmexec()+1452<-evapls()+1251<-evaopn2()+737<-upderh()+1252<-upduaw()+193<-kdusru()+617<-kauupd()+356<-updrow()+1693<-qerupUpdRow()+725<-qerupFetch()+644<-updaul()+1416<-updThreePhaseExe()+340<-updexe()+443<-opiexe()+11783<-opipls()+2086<-opiodr()+1202<-rpidrus()+198<-skgmstack()+65<-rpidru()+132<-rpiswu2()+541<-rpidrv()+1248<-psddr0()+467<-psdnal()+624<-pevm_EXECC()+306<-pfrinstr_EXECC()+56<-pfrrun_no_tool()+52<-pfrrun()+902<-plsql_run()+752<-peicnt()+282<-kkxexe()+720<-opiexe()+30719<-kpoal8()+2387<-opiodr()+1202<-ttcpip()+1222<-opitsk()+1897<-opiino()+936<-opiodr()+1202<-opidrv()+1094<-sou2o()+165<-opimai_real()+422<-ssthrdmain()+417<-main()+256<-__libc_start_main()+245

因为当前的SQL正在执行java代码部分,说明该存储过程有java语言,需要排查java代码 。

SQL> @ddl ANBOB_U1.JAVA_ENCRY_F
PL/SQL procedure successfully completed.

DBMS_METADATA.GET_DDL(OBJECT_TYPE,OBJECT_NAME,OWNER)
------------------------------------------------------------------------------------------------------
  CREATE OR REPLACE EDITIONABLE FUNCTION "ANBOB_U1"."JAVA_ENCRY_F" (code VARCHAR2)
RETURN VARCHAR2
AS LANGUAGE JAVA
    NAME 'PassWord.encode(java.lang.String) return java.lang.String';
/

再继续分析JAVA 代码部分发现,对应的表中有一条记录,处理进入列循环, while(true) { if xxx } 判断出了问题。

所以到此能明确是因为当前会话执行的SQL,使用了java function, 因为java程序代码缺陷导致SQL一直处理spin(无限循环中). 对于这类问题我个人觉的是程序设计问题,为什么一个加密操作又是java又是db?如果是我,我想要么1,加密在程序中完成,计算后的值存入DB;2,完全使用数据库的加密,如使用dbms_crypto等内置package完成。

Viewing all 691 articles
Browse latest View live