前段时间的一个案例,突然好几个数据库出现了ora-600 坏块相关的错误, 但是幸运的是使用rman, dbv, analyze table validate structure 都没有实际的坏块, 也就是说很可能只是出现在memroy 中,目标和源都是11.2.0.3.7 2nodes RAC, 最终是确认了为Procedure中使用了DBLINK触发,local db HPUX, remote db AIX。
# Remote database errors
ORA 600 [6101]
ORA 600 [kdsgrp1]
ORA 600 [kdBlkCheckError]
ORA 600 [17182]
ORA 600 [kghfrempty:ds]
ORA 600 [17114]
ORA 600 [6856]
ora-600 [18301]
ORA 600 [4000]

Error Stack: ORA-600[6101]
Main Stack:
kdxlin <- kco_issue_callback <- kcoapl <- kcbchg1_main <- kcbchg <- ktuapundo <- kdiulk
<- kcoubk <- ktundo <- kturCRBackoutOneChg <- ktrgcm <- ktrget3 <- ktrget2 <- kdifxs1 <- kdifxs
<- qerixtFetch <- qerpfRealFetch <- qerpfFetch <- qertbFetchByRowID <- qergiFetch
<- opifch2 <- opifch <- opiodr <- ttcpip <- opitsk <- opiino <- opiodr <- opidrv <- sou2o
<- opimai_real <- ssthrdmain <- main 1>

1< ***** Error Stack *****
 ORA-00600: internal error code, arguments: [6101], [17], [27], [1], [], [], [], [], [], [], [], []
1< ***** Error Stack *****
 Error 600 in redo application callback
 Dump of change vector:
 TYP:0 CLS:1 AFN:295 DBA:0x49c34feb OBJ:4210502 SCN:0x0ea4.9a21fec2 SEQ:0 OP:10.2 ENC:0 RBL:0
 index redo (kdxlin): insert leaf row
 KTB Redo
 op: 0x02 ver: 0x01
 compat bit: 4 (post-11) padding: 1
 op: C uba: 0x4ac03e52.1a95.1e
 UNDO: SINGLE split flag / CLEAR / -- / -- / --
 itl: 1, sno: 147, row size 27
 insert key: (23):
 07 78 76 0b 05 09 36 25 04 c3 14 01 02 02 c1 02 06 6c 4e a3 12 00 06
 Block after image is corrupt:
 buffer tsn: 29 rdba: 0x49c34feb (295/217067)
 scn: 0x0ea4.9a21fec2 seq: 0x00 flg: 0x00 tail: 0xfec20600
 frmt: 0x02 chkval: 0x0000 type: 0x06=trans data
 Hex dump of block: st=0, typ_found=1

2> ***** Current SQL Statement for this session (sql_id=9wz0u7aqusy24) *****
 SELECT ROWID,"CYCLEID","REGION","SUBSID","PARAID","REMINDTIME","TRANSFLAG","FORMNUM" FROM "ANBOB"."XXXX_DETAIL_LOG" "T" WHERE "TRA
 NSFLAG"=1 AND "REGION"=:1 AND ("CYCLEID"=:2 OR "CYCLEID"=:3) AND "REMINDTIME">TO_DATE(TO_CHAR(:4-1,'yyyymmdd'),'yyyymmdd') AND "FORMNUM" IS NO
 T NULL AND "PARAID"=:5


Error Stack: ORA-600[kdsgrp1]
Main Stack:
kdsgrp1_dump <- kdsgrp1 <- kdsgrp <- qetlbr <- qertbFetchByRowID <- qergiFetch <- opifch2
<- opifch <- opiodr <- ttcpip <- opitsk <- opiino <- opiodr <- opidrv <- sou2o <- opimai_real
<- ssthrdmain <- main

=====================================================
Error: ORA-00600 [kghfrempty:ds]   ORA-00600  [17182]

Main Stack:

   kghnerror <-        kghfrempty <-
        kghgex <-        kghalf <-        kdbmal <-        kdxd4ckf <-        kdxdmp <-
        ktbtdu <-        ktbdbh <-        ktbdbhw <-        kcbtdu <-        kcbzdh <-
        kcbzsp <-        kssdmp1 <-        kssdmh <-        ksudmc <-        kssdmp1 <-
        kssdmh <-        ksudmp_proc <-        ksudmp <-        kssdmp <-        ksudps <-
        dbkedDefDump <-        ksedmp <-        ksfdmp <-        dbgexPhaseII <-        dbgexExplicitEndInc   <-
         <-        dbgeEndDDEInvocationImpl <-        dbgeEndDDEInvocation <-
        kgherror <-        kghfrf <-        kdbmfr <-        kdb4cpss <-        kdbcpss <-
        kdourp2 <-        kdourp <-        kco_issue_callback <-       kcoapl <-
        kcbchg1_main <-        kcbchg <-        ktuapundo <-        kdoiur <-        kcoubk <-
        ktundo <-        kturCRBackoutOneChg   <-         <-        ktrgcm <-        ktrget3 <-
        ktrget2 <-        kdsgrp <-        qetlbr <-        qertbFetchByRowID <-        +748                  <-
        qergiFetch <-        opifch2 <-        opifch <-        opiodr <-        ttcpip <-
        opitsk <-        opiino <-        opiodr <-        opidrv <-        sou2o <-
        opimai_real <-        ssthrdmain <-        main <- 1>     ***** Error Stack *****
       ORA-00600: internal error code, arguments: [kghfrempty:ds], [0x11093B7E0], [], [], [], [], [], [], [], [], [], []
       ORA-00600: internal error code, arguments: [17182], [0x11093B7F0], [], [], [], [], [], [], [], [], [], []

1<     ***** Error Stack *****
        Total heap size    =318910464
        FREE LISTS:
         Bucket 0 size=88
          Chunk        11093fc58 sz=        0    kghdsx
         Bucket 1 size=280
          Chunk        11093fc88 sz=      744    free      "               "
         Bucket 2 size=1048
        Total free space   =      744
        UNPINNED RECREATABLE CHUNKS (lru first):
        PERMANENT CHUNKS:
          Chunk        11093fc38 sz=       80    perm      "perm           "  alo=80
        Permanent space    =       80
        ******************************************************
         Hla: 255
2< ***** End of Customized Incident Dump(s) ***** *** 2018-10-27 18:08:37.457 dbkedDefDump(): Starting incident default dumps (flags=0x2, level=3, mask=0x40) 2>      ***** Current SQL Statement for this session (sql_id=9wz0u7aqusy24) *****
        SELECT ROWID,"CYCLEID","REGION","SUBSID","PARAID","REMINDTIME","TRANSFLAG","FORMNUM" FROM "ANBOB"."XXXX_DETAIL_LOG" "T" WHERE "TRA
        NSFLAG"=1 AND "REGION"=:1 AND ("CYCLEID"=:2 OR "CYCLEID"=:3) AND "REMINDTIME">TO_DATE(TO_CHAR(:4-1,'yyyymmdd'),'yyyymmdd') AND "FORMNUM" IS NO
        T NULL AND "PARAID"=:5
2< ***** current_sql_statement ***** ========================================================== Error: ORA-00600 [17114] >     ***** Error Stack *****
       ORA-00600: internal error code, arguments: [17114], [0x11093B7C8], [], [], [], [], [], [], [], [], [], []
       ORA-00600: internal error code, arguments: [17182], [0x11093B7F0], [], [], [], [], [], [], [], [], [], []
1<     ***** Error Stack *****
      Error 600 in redo application callback
      Dump of change vector:
      TYP:0 CLS:1 AFN:245 DBA:0x3d408e55 OBJ:3877590 SCN:0x0e9f.ddf74211 SEQ:0 OP:11.5 ENC:0 RBL:0    <<<<<<<<<<< KTB Redo op: 0x02 ver: 0x01 compat bit: 4 (post-11) padding: 1 op: C uba: 0x00848c5e.4f79.09 KDO Op code: URP row dependencies Disabled xtype: CR flags: 0x00000000 bdba: 0x3d408e55 hdba: 0xd685eac2 itli: 1 ispac: 0 maxfr: 9774 tabn: 0 slot: 49(0x31) flag: 0x2c lock: 0 ckix: 14 ncol: 67 nnew: 2 size: -15 col 47: [ 1] 80 col 52: *NULL* Block after image is corrupt: buffer tsn: 6 rdba: 0x80018001 (512/98305) scn: 0x8001.80018001 seq: 0x80 flg: 0x01 tail: 0x42110600 frmt: 0x02 chkval: 0x8001 type: 0x13=unknown Hex dump of corrupt header 4 = CORRUPT Dump of memory from 0x0700000338DCC000 to 0x0700000338DCC014 700000338DCC000 13023001 80018001 80018001 80018001 [..0.............] 700000338DCC010 80018001 [....] Hex dump of block: st=4, typ_found=0 Dump of memory from 0x0700000338DCC000 to 0x0700000338DD0000 SQL> @oid 3877590

owner                     object_name                    object_type        SUBOBJECT_NAME                 CREATED           LAST_DDL_TIME     status    DATA_OBJECT_ID
------------------------- ------------------------------ ------------------ ------------------------------ ----------------- ----------------- --------- --------------
ANBOB                   XXXX_DETAIL_LOG      TABLE PARTITION    PART_201810_312                20180919 23:53:26 20180919 23:53:26 VALID            3877590

==========================================================
Error: ORA-00600 [6856]

Error Stack: ORA-600[6856] [0], [28], [], [], [], [], [], [], [], [], []
Main Stack:
dbgePostErrorKGE    <-dbkePostKGE_kgsf <
kgeade <-kgeriv_int <-kgeriv <-kseipre <-ksesic2 <-
kdbmrd <-kdoqmd <-kco_issue_callback      <-kcoapl <-
kcbchg1_main <-kcbchg <-ktuapundo <-kdoiur <-kcoubk <-
ktundo <-kturCRBackoutOneChg   <-ktrgcm <-ktrget3 <-
ktrget2 <-kdsgrp <-qetlbr <-qertbFetchByRowID      <-
qergiFetch <-qergsFetch <-opifch2 <-kpoal8 <-opiodr <-
ttcpip <-opitsk <-opiino <-opiodr <-opidrv <-
sou2o <-opimai_real <-ssthrdmain <-main <-_

Error 607 in redo application callback
Dump of change vector:
TYP:0 CLS:1 AFN:874 DBA:0xda802610 OBJ:3640041 SCN:0x0ea1.d72a508b SEQ:0 OP:11.12 ENC:0 RBL:0   <<<<<<<<<<<<<
KTB Redo
op: 0x04  ver: 0x01
compat bit: 4 (post-11) padding: 1
op: L  itl: xid:  0x0cfd.00d.00b6cac5 uba: 0xbdc44229.f110.08
                      flg: C---    lkc:  0     scn: 0x0ea1.d6ebe91f
KDO Op code: QMD row dependencies Disabled
  xtype: CR flags: 0x00000000  bdba: 0xda802610  hdba: 0xd948a145
itli: 2  ispac: 0  maxfr: 9774
tabn: 0 lock: 0 nrow: 2
slot[0]: 28
slot[1]: 29
Block after image is corrupt:
buffer tsn: 8 rdba: 0xda802610 (874/9744)
scn: 0x0ea1.d72a508b seq: 0x00 flg: 0x00 tail: 0x508b0600
frmt: 0x02 chkval: 0x0000 type: 0x06=trans data
Hex dump of block: st=0, typ_found=1

...
Block header dump:  0xda802610
 Object id on Block? Y
 seg/obj: 0x378ae9  csc: 0xea1.d728b4b9  itc: 2  flg: E  typ: 1 - DATA
     brn: 0  bdba: 0xda802540 ver: 0x01 opc: 0
     inc: 0  exflg: 0

 Itl           Xid                  Uba         Flag  Lck        Scn/Fsc
0x01   0x0cb6.035.00b3a91d  0xbdc0b840.fc03.1d  C---    0  scn 0x0ea1.d6ec07a9
0x02   0x0db6.028.00cc849a  0xbd830df9.dffe.0b  C---    0  scn 0x0ea1.d6ffe970
bdba: 0xda802610
data_block_dump,data header at 0x7000000e0d24064

----- Current SQL Statement for this session (sql_id=aatzumckd8p18) -----
select   count(1) from XXXX_DETAIL_LOG t^M
  where t.cycleid = to_number(to_char(sysdate,'yyyymm')) and t.transflag = 0     ^M
    and paraid in^M
    (^M
      '190037','190038','190039','190040','190041','190042',^M
      '190043','190044','190045','190046','190047','190048','190049','190050','190051'^M
    )

==========================================================
Error: ORA-00600 [4000]

Error Stack: ORA-600 [4000], [16220], [], [], [], [], [], [], [], [], [], []
1< ***** Error Stack ***** 1>     ***** Dump for incident 855241 (ORA 600 [4000]) *****

       *** 2018-10-26 18:06:30.359
       dbkedDefDump(): Starting incident default dumps (flags=0x2, level=3, mask=0x0)
2>      ***** Current SQL Statement for this session (sql_id=9wz0u7aqusy24) *****
        SELECT ROWID,"CYCLEID","REGION","SUBSID","PARAID","REMINDTIME","TRANSFLAG","FORMNUM" FROM "ANBOB"."XXXX_DETAIL_LOG" "T" WHERE "TRA
        NSFLAG"=1 AND "REGION"=:1 AND ("CYCLEID"=:2 OR "CYCLEID"=:3) AND "REMINDTIME">TO_DATE(TO_CHAR(:4-1,'yyyymmdd'),'yyyymmdd') AND "FORMNUM" IS NO
        T NULL AND "PARAID"=:5
2<      ***** current_sql_statement *****

	----- Call Stack Trace -----
skdstdst <-ksedst <-dbkedDefDump <-ksedmp <-ksfdmp <-
$cold_dbgexPhaseII <-)+576       <-dbgexProcessError <-+2096       <-dbgeExecuteForError  call     <-
 <-dbgePostErrorKGE <-2368    <-dbkePostKGE_kgsf <-128      kgeade <-kgesev
 <-ksesec1 <-npierr <-kpnerr <-kpnpst <-upirtrc <-kpurcsc <-kpufch0 <-kpufch
 <-OCIStmtFetch <-qerrmOFBu <-qerrmFBu <-qerrmFetch <-qerjotRowProc <-
   <-qersoFetch <-qerjotFetch <-opifch2 <-opifch <-
opipls <-opiodr <-rpidrus <-skgmstack <-rpidru <-
rpiswu2 <-rpidrv <-psddr0 <-psdnal <-pevm_BFTCHC <-
pfrinstr_BFTCHC   <-pfrrun_no_tool    <-pfrrun <-
plsql_run <-peidxr_run <-peidxexe <-kkxdexe <-kkxmpexe <-
kgmexwi <-kgmexec <-evapls <-evaopn2 <-kkxmexcs <-
opiexe <-kpoal8 <-opiodr <-ttcpip <-opitsk <-
opiino <-opiodr <-opidrv <-sou2o <-opimai_real <-
ssthrdmain <-main
Note:
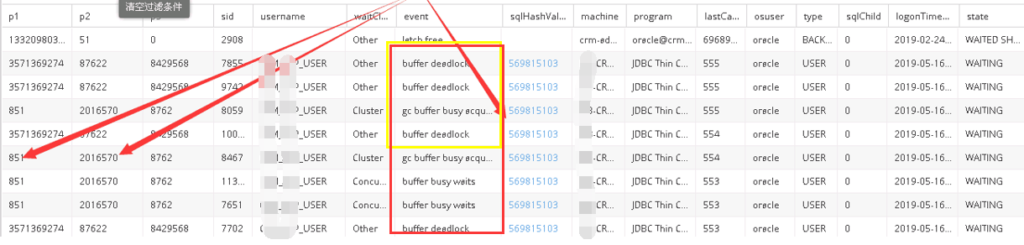
所有的错误都指向了同一张表。
# Local db errors
Errors in file /oracle/app/oracle/diag/rdbms/weejar/weejar1/trace/weejar1_ora_3914.trc  (incident=3335114):
ORA-00600: internal error code, arguments: [ORA-00600: internal error code, arguments: [4000], [16220], [], [], [], [], [], [], [], [], [], []
], [], [], [], [], [], [], [], [], [], [], []
ORA-02063: preceding line from LNK_ANBOB_C1
Incident details in: /oracle/app/oracle/diag/rdbms/weejar/weejar1/incident/incdir_3335114/weejar1_ora_3914_i3335114.trc
	ORA-00600: internal error code, arguments: [ORA-00600: internal error code, arguments: [4000], [16220], [], [], [], [], [], [], [], [], [], []
], [], [], [], [], [], [], [], [], [], [], []
ORA-02063: preceding line from LNK_ANBOB_C1

Incident 3335115 created, dump file: /oracle/app/oracle/diag/rdbms/weejar/weejar1/incident/incdir_3335115/weejar1_ora_3914_i3335115.trc
ORA-00700: soft internal error, arguments: [kgerev1], [600], [600], [700], [], [], [], [], [], [], [], []

Incident 3335116 created, dump file: /oracle/app/oracle/diag/rdbms/weejar/weejar1/incident/incdir_3335116/weejar1_ora_3914_i3335116.trc
ORA-00600: internal error code, arguments: [], [], [], [], [], [], [], [], [], [], [], []


Dump continued from file: /oracle/app/oracle/diag/rdbms/weejar/weejar1/trace/weejar1_ora_3914.trc
ORA-00700: soft internal error, arguments: [kgerev1], [600], [600], [700], [], [], [], [], [], [], [], []

========= Dump for incident 3335115 (ORA 700 [kgerev1]) ========

*** 2018-10-26 18:07:24.668
dbkedDefDump(): Starting incident default dumps (flags=0x2, level=3, mask=0x0)
----- Current SQL Statement for this session (sql_id=c9hrbhcy0t0vt) -----
call ANBOB.LOC_KAFKA_TOPIC_NOTIFY_PRO(319)
----- PL/SQL Stack -----
----- PL/SQL Call Stack -----
  object      line  object
  handle    number  name
c0000013d53e4c10        67  procedure ANBOB.LOC_KAFKA_TOPIC_NOTIFY_PRO

----- Call Stack Trace -----
skdstdst <-ksedst <-dbkedDefDump <-ksedmp <-ksfdmp <-
$cold_dbgexPhaseII <-)+576   <-dbgexProcessError  <-dbgeExecuteForError  call     <-
 <-dbgePostErrorKGE <-2368    <-dbkePostKGE_kgsf <-
kgeade <-kgesev <-ksesec1 <-npierr <-kpnerr <-
kpnpst <-upirtrc <-kpurcsc <-kpufch0 <-kpufch <-
OCIStmtFetch <-qerrmOFBu <-qerrmFBu <-qerrmFetch <-qerjotRowProc <-
<-qersoFetch <-qerjotFetch <-opifch2 <-opifch <-
opipls <-opiodr <-rpidrus <-skgmstack <-rpidru <-
rpiswu2 <-rpidrv <-psddr0 <-psdnal <-pevm_BFTCHC <-
pfrinstr_BFTCHC  <-pfrrun_no_tool <-pfrrun <-
plsql_run <-peidxr_run <-peidxexe <-kkxdexe <-kkxmpexe <-
kgmexwi <-kgmexec <-evapls <-evaopn2 <-kkxmexcs <-
opiexe <-kpoal8 <-opiodr <-ttcpip <-opitsk <-
opiino <-opiodr <-opidrv <-sou2o <-opimai_real <-
ssthrdmain <-main


# 存储过程伪代码
procedure ANBOB.LOC_KAFKA_TOPIC_NOTIFY_PRO
is
begin
 for i in(select xx,rowid from XXXX_DETAIL_LOG@LNK_ANBOB_C1 where xx) loop
     if xx
        update XXXX_DETAIL_LOG@LNK_ANBOB_C1  t set xx where t.rowid = i.rowid;
     end if;
end;
对于上面的错误尝试flash buffer_cache, restart instance, recreate index 都未绕过错误。但是CTAS后短时没有再发生,不确认原因。 在目前的已知BUG中没有完全matched BUG. 不过与Bug 20368850 : ORA-600 [KDXLIN: SNO OUT OF RANGE]很像。
it may have changed many keys in index leaf block which needs to be read concurrently. So when there is insufficient space in the block to fit in the key to rollback for read. Oracle would compact the block and shrink the itl which it could use improper function to generate corruption.
Bug 20368850
PROBLEM DESCRIPTION:
Block corruption from kdxlin() during undo apply for CR.
.
In the failing case, the situation is as follows: an index leaf block has
some keys deleted by several transaction. The presence of multiple
transactions increases the itl size to 8 entries.
.
During cr, we rollback the transactions (7 in total). When we come to
process the last of these, there is insufficient space in the block
to fit in the key. This txn uses itl entry 4. We compact the block and
then shrink the itl in kdxlin() by calling ktbsit(). However, during cr
we do not maintain the itl entries the same as for regular undo. So in
ktbsit() we do not see itl entry 4 as active, we end up shrinking the
list right back to 2 entries.
After the space is recovered, the key is inserted and all is well. Then
at the end of kdxlin() we process the transaction layer undo via a call
to ktbair(). Because this is using the itl index frmo the redo – 4 in
our case – we end up changing itl entry 4 even though there are only 2
itl entries after the compact/shrink done earlier. The result is that
we end up corrupting the row index. Depending on the block layout and
degree of itl shrink, we can also corrupt the block header.
FIX DESCRIPTION:
I amended kdxlin() so that we now call ktbShrinkItlsToLimit() using
the itl number from the redo as a lower limit for itl shrinking. Before
this call I assert that the itl index from the redo is within the itl of
the block.
Summary:
最后确认了是一个新上的PROCEDURE, 使用了DBLINK, 并使用ROWID更新,不建议通常DBLINK做DML, 非关键业务最终是下线了该存储过程。 如果可以可以尝试不用rowid , 或把DML 的对象放到LOCAL 实例。